Insights
KR Decarbonization Magazine
VOL.07 | Summer 2024

Customized Decarbonization Strategy
for Shipping Company
CHO Joonho, Technical Business Development Team

|
Background and Action Plan
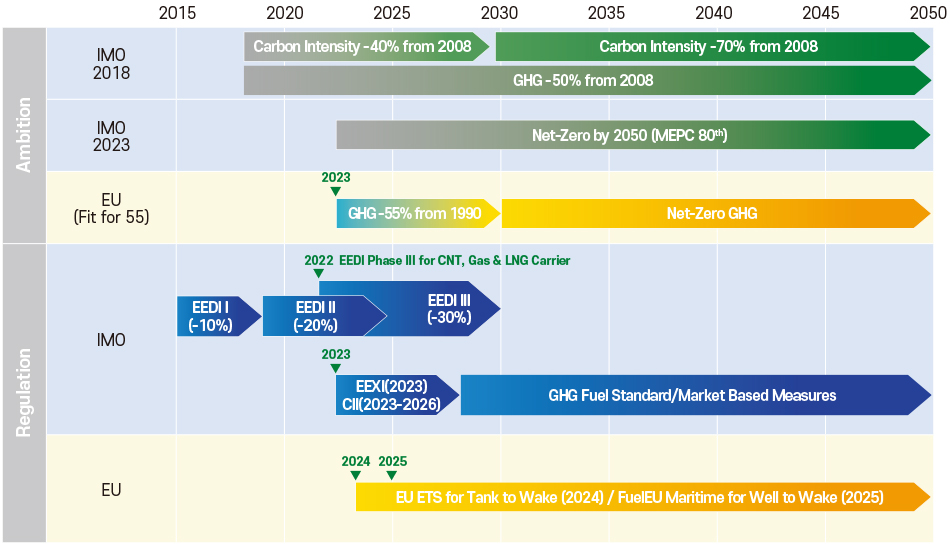
Due to strengthening IMO environmental regulations, shipping companies' concerns about building a sustainable future are increasing. At the MEPC 80 meeting held in 2023, IMO set a goal of reaching Net-Zero by around 2050, and it will be regulated through medium-term measures that combine the GFS (GHG Fuel Standard) based on LCA (Life Cycle Assessment) guideline and market-based measures in addition to existing short-term measures.
Therefore, it is essential for each shipping company to establish a decarbonization strategy to increase energy efficiency and reduce GHG emissions. To effectively achieve decarbonization, a customized decarbonization strategy is required according to the status of each shipping company's fleet, and furthermore, action plans that optimize the operational, technical, and economic aspects of each ship must be prepared. In 2023, KR conducted a joint study on decarbonization strategies with a Korean shipping company, and we will introduce the contents. This content is a summary of the joint study results. The company name, ship type, and vessel name have been anonymized, and some contents of the table have been edited or deleted to protect the anonymity.
Identify Fleet GHG Emissions
The vessels subject to the shipping company's customized decarbonization strategy are 46 vessels registered on the KR GEARs platform, including 32 vessels of type A, 8 vessels of ship type B, 5 vessels of ship type C, and 1 vessel of ship type D.
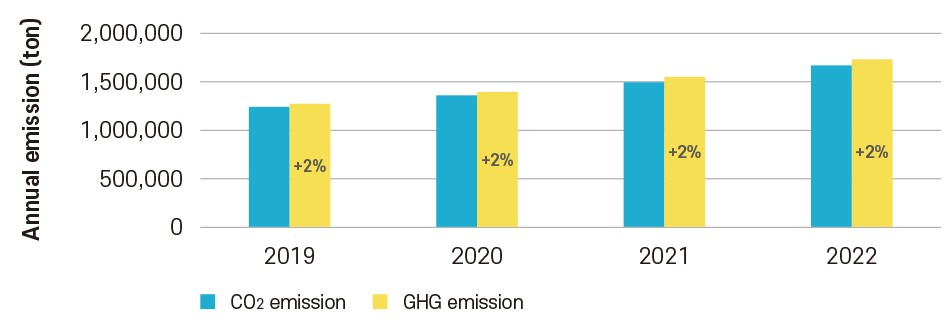
Based on DCS data reported through KR Gears, CO2 emissions for four years from 2019 to 2022 were reviewed, and total GHG emissions, including methane (CH4) and nitrous oxide (N2O), were also predicted.
Annual Total GHG Emission
Expected Penalty Costs
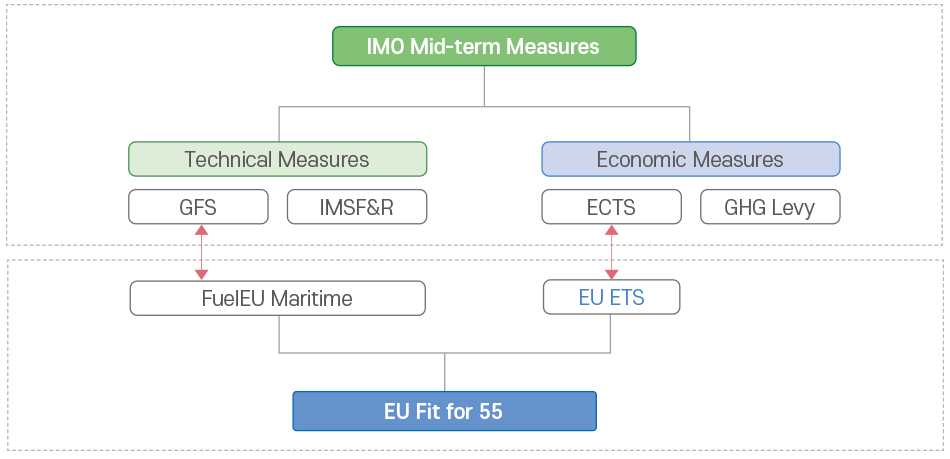
At the time of conducting this study, since the penalty impact of IMO's mid-term measures could not be confirmed, it was assumed that the EU ETS and FuelEU Maritime regulations of EU Fit for 55, which currently apply only to ships calling at EU ports, were applied to the entire route. The figure below shows the EU Fit for 55 regulations corresponding to the IMO medium-term measures.
The annual penalty costs for IMO medium-term measures and EU Fit for 55 evaluated based on the shipping company's 2022 IMO DCS (Data Collection System) and EU MRV (Monitoring, Reporting & Verification) reporting data are as follows. Assuming the penalty-based cost is the same amount, the cost incurred due to EU port calls was approximately 7% of the total operation based on IMO DCS, and it can be seen that it increases rapidly over time.
(Unit: mil. USD)
| YEAR | 2024 | 2025 | 2026 | 2030 | 2035 | 2040 | 2045 | 2050 | |
|---|---|---|---|---|---|---|---|---|---|
| IMO DCS Base | ECTS | 62 | 109 | 159 | 159 | 159 | 159 | 159 | 159 |
| GFS | 0 | 34 | 34 | 90 | 208 | 437 | 868 | 1,118 | |
| EU MRV Base | EU ETS | 4 | 7 | 11 | 11 | 11 | 11 | 11 | 11 |
| FuelEU Maritime | 0 | 2 | 2 | 6 | 14 | 29 | 58 | 74 | Total (IMO DCS) | 62 | 143 | 193 | 249 | 367 | 596 | 1,027 | 1,277 |
| Total (EU MRV) | 4 | 10 | 13 | 17 | 24 | 40 | 68 | 85 | |
*Assumption: ECTS(≈ EU ETS): 90USD/tonCO2eq, GFS(≈ FuelEU Maritime): (2,400Euro/tonFuel)
Setting of own GHG reduction goals by shipping company
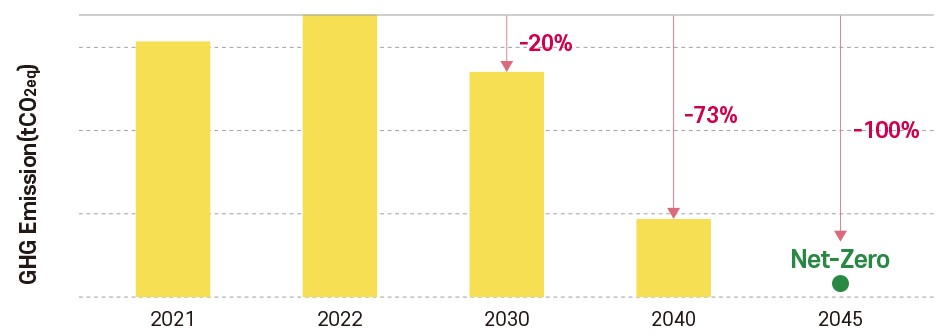
The IMO 2023 GHG reduction strategy aims to achieve Net-Zero by 2050. However, in order to achieve faster decarbonization, the shipping company has set a Net-Zero goal of 2045, five years ahead of the IMO goal. Accordingly, this study also set 2045 as the Net-Zero target deadline, and as an intermediate goal, the carbon intensity target of individual ships was set at 40% in 2030 and 80% in 2040 to evaluate the overall GHG emissions reduction.
Carbon Intensity Reduction Target
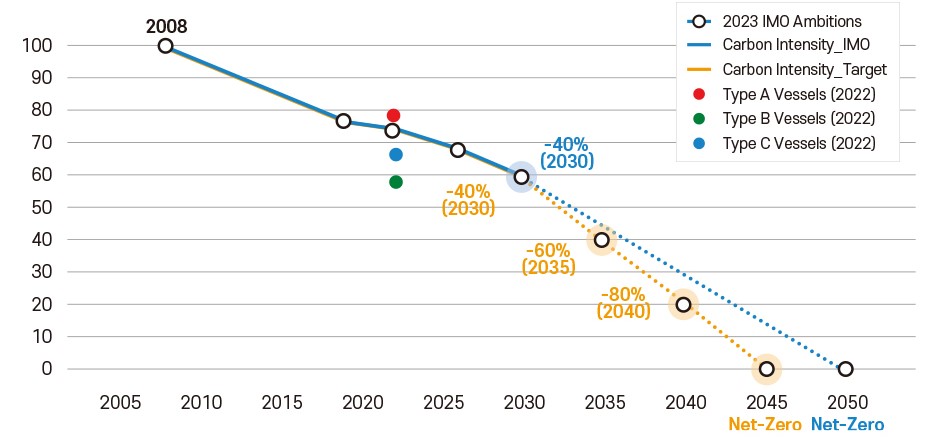
If the carbon intensity target for the 46 ships carried out in this project is set as mentioned above, GHG emissions can be reduced by 20% in 2030 compared to 2022, reduced by 73% in 2040, and Net-Zero can be achieved in 2045.
Target GHG Reduction
Reduction Measures for Each Vessel
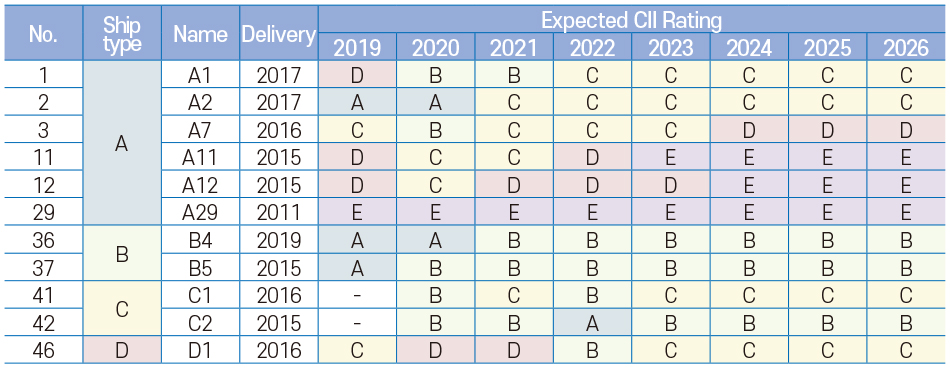
CII Calculation and Expected Rating for Each Vessel
We reviewed the expected CII rating for each vessel of this shipping company, which has been in effect since 2023. It was calculated based on IMO DCS data for 2022, and the expected CII rating until 2026 was evaluated as follows.
In particular, for some ships of Ship Type A, SEEMP Part III re-approval including corrective action plan was required due to low CII rating, but for Ship Types B, C, and D, no additional action was expected to be required.
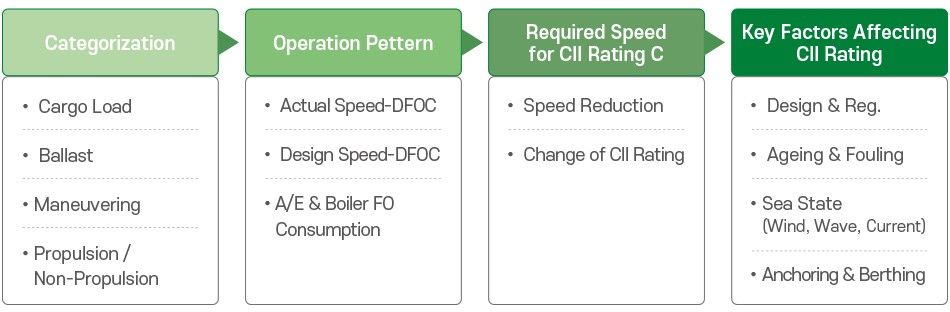
Review operational measures (speed, operating pattern, etc.)
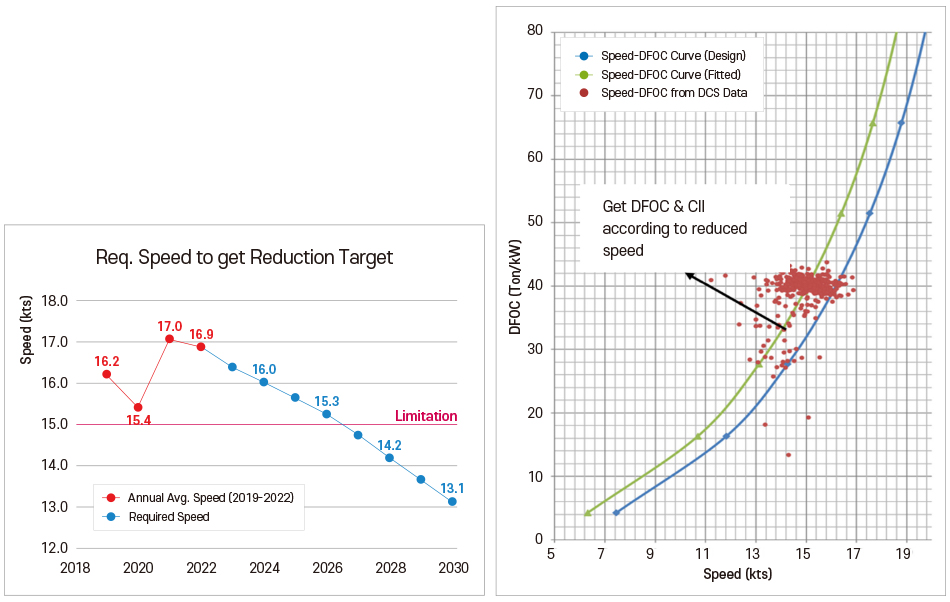
To mitigate GHG emissions, it's essential to initially assess the operational patterns of each vessel and evaluate improvement strategies through operational measures. This entails systematically gathering data on key factors such as operating speed, power, berth days, cargo volume, etc., for each ship annually or per voyage to analyze the reasons behind low CII ratings and operate ships with higher CII ratings. Optimized operational guidelines must be developed by benchmarking these patterns. For CO2 emissions analysis, daily fuel consumption was scrutinized using IMO DCS data and the ship's Noon Report. Consequently, operational patterns were examined, fuel consumption was categorized, and feasible speeds for maintaining CII Rating C were assessed. Furthermore, factors such as design, fouling, sea conditions, anchoring, and berthing effects, which influence the CII grade, were analyzed.
IMO DCS Data Analysis
Following the analysis of operational patterns, aging effects were not identified; however, fouling was observed two years after dry docking. The influence of design characteristics was examined, and the degree of speed loss based on sea conditions was also analyzed. Furthermore, vessels with high anchoring and berthing frequencies were identified.
Review Measures
Seven options were implemented to reduce CO2 emissions, encompassing the operational measures examined earlier, as well as high-performance antifouling paint, biodiesel, energy-saving devices, modifications to alternative fuel engines, and shipboard carbon capture devices.
The measures were optimized by combining options for each ship to comply with the designated CO2 emissions target, and detailed measures, costs, CO2 reduction were omitted due to space constraints.
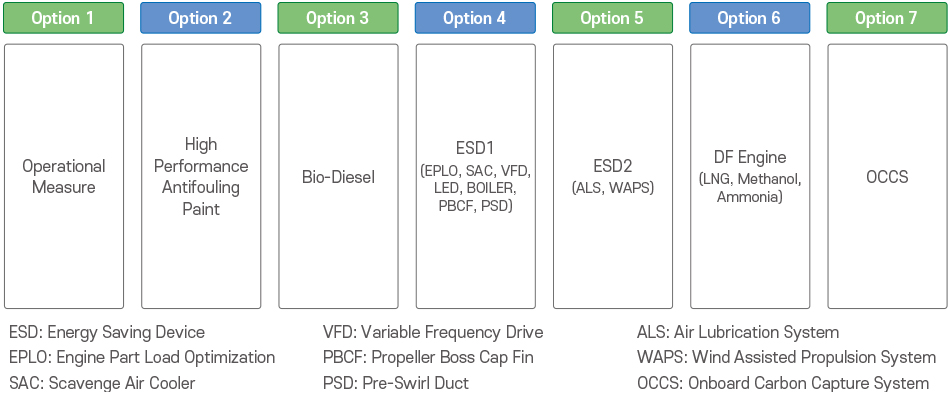
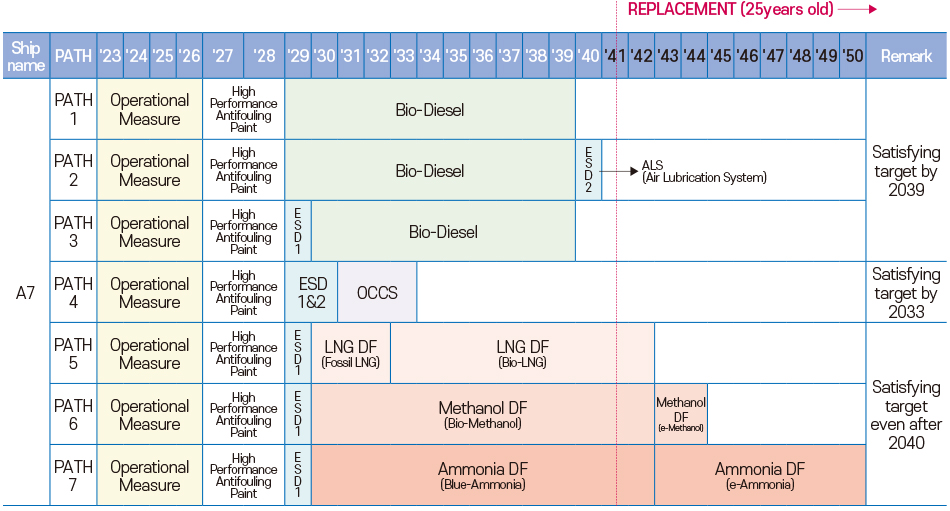
Setting Paths according to Measures
By combining the order from easy to difficult to apply the seven options above, seven complex measures (Paths) were set and the optimal measures were reviewed. Below are the measures for each path for a target vessel.
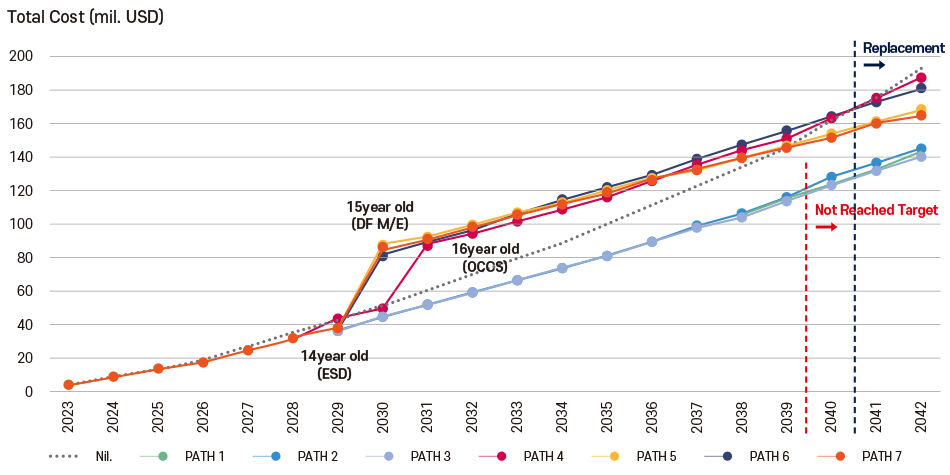
Economic Evaluation base the Paths
The above measures were created in the same way for all ships, and an economic feasibility assessment was conducted by reflecting the costs for each option.
The below figure shows the cumulative cost by Paths for the A7 ship. While the cumulative costs of Path 2 and Path 3 are low, it can also be seen that ships that choose this Paths will not meet the target until after 2039. Therefore, in the case of this ship, it should be needed additional measures (e.g. change of ship route, etc.) before 2039.
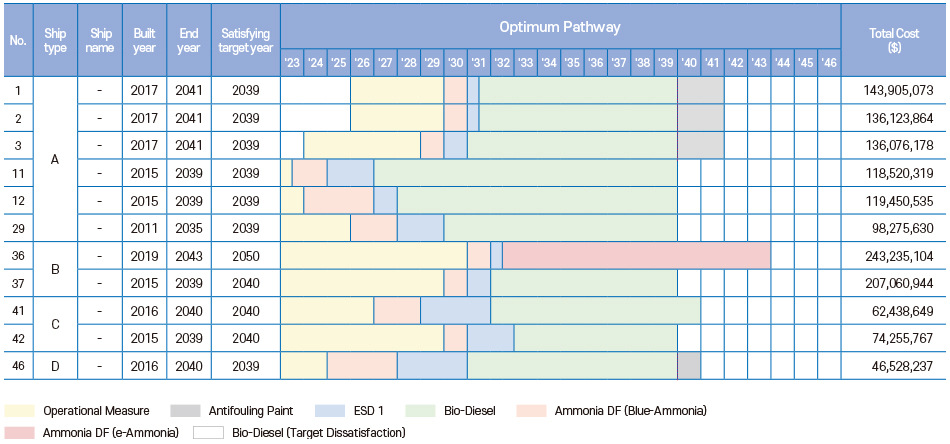
Customized Decarbonization Strategy
Using the same method as above, the entire ship was reviewed and evaluated under the assumption of sale at 25 years of ship age. The difference between the total cost of 46 ships based on 25 years of age when the optimal path is adopted and when no measures are taken and the ship operates in its current state is “1,468 million USD,” which can result in a cost reduction of approximately 21%.
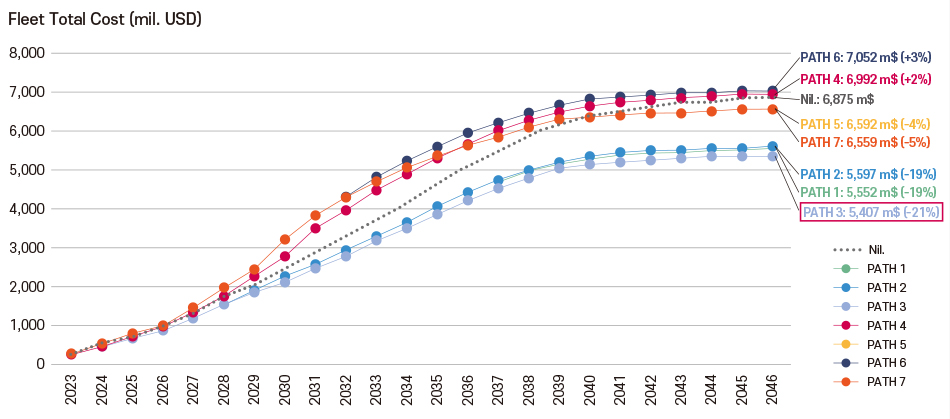
The figure below shows the optimal application year for each option for the fleet.
Conclusion
In order to achieve IMO's carbon reduction goals, it is necessary to switch to low-carbon, zero-carbon, eco-friendly fuel ships in the mid- to long-term. However, if we establish an effective customized decarbonization strategy for existing ships and apply it to ships, we believe that it will be able to have a great effect in reducing GHGs of shipping company and sufficiently secure market competitiveness throughout the ship's life cycle.
In particular, decarbonization strategies should be updated through continuous updates of the following items.
| ① | Setting annual decarbonization goals | |
|---|---|---|
| ② | Application of a digital platform that can systematically manage operational measures | |
| ③ | Review of application of energy saving technology suited to individual ships | |
| ④ | Review biofuel supply and engine modification feasibility | |
| ⑤ | Setting the optimal route through economic evaluation: bio-diesel fuel (short-term), alternative fuel conversion (long-term) | |
| ⑥ | Monitoring of technologies related to ammonia fuel conversion and shipboard carbon capture storage and processing | |
| ⑦ | Continuous update of decarbonization strategy | |

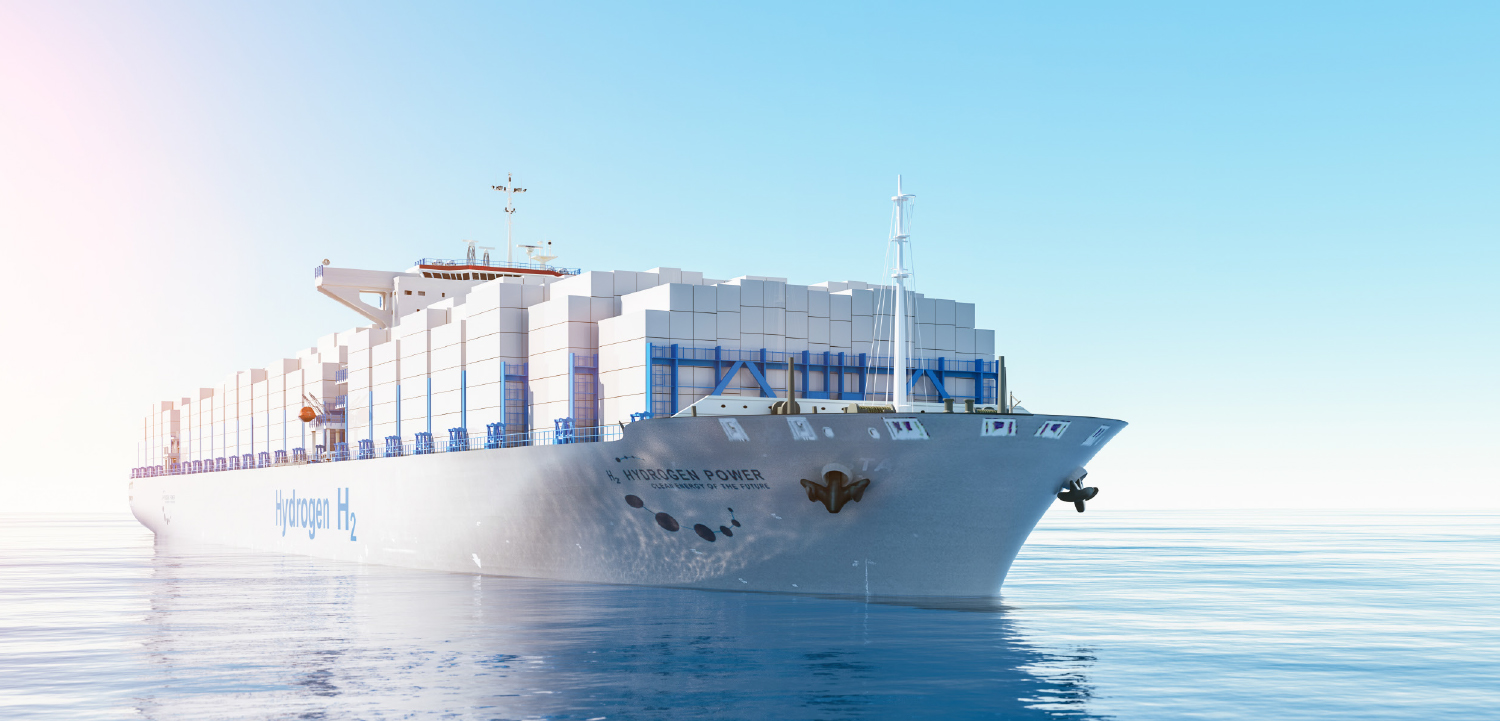
Navigating the Future
of Hydrogen Transport
ROH Giltae, Principal Surveyor of Alternative Fuel Technology Research Team

|
In implementing the Paris Agreement, the Nationally Determined Contributions (NDCs) are crucial benchmarks aiming for an average reduction of greenhouse gas emissions by 40% by the year 2030. To achieve these ambitious targets, countries are increasingly turning to hydrogen imports. In particular, South Korea, Japan, and Taiwan face a substantial shortfall, as their local production relying on fossil-fuel-based blue hydrogen and renewable-based green hydrogen cannot meet their energy demands, leading them to import over 80% of their hydrogen needs. Similarly, Europe and China are enhancing their domestic production of clean hydrogen but are still categorized as net importers. On the other hand, regions such as the Middle East, Australia, the USA, and South America are emerging as potential hydrogen exporters due to their abundant natural resources including renewable energy.
Currently, LNG serves as a primary method of energy transportation from continent to continent. However, hydrogen is expected to take over as the clean energy transportation method of the future. The International Energy Agency (IEA) predicts that by 2030, around 200 million tonnes, and by 2050, up to 500 million tonnes of hydrogen will be produced worldwide for use in ships, road transport, aviation, and industry.
Hydrogen Transport Options
Ammonia as a Hydrogen Carrier
Ammonia offers a viable solution for the global transport of hydrogen, particularly because it liquefies at -33 degrees Celsius, facilitating easier storage and transport. Currently, the global production of ammonia is primarily for fertilizer use, with an annual output of about 200 million tons and trade volumes around 18 million tons. However, projections suggest a significant increase to 340 million tons by 2035 as ammonia begins to play a role in coal power generation and serves as a zero-carbon fuel for ships. Despite these advantages, ammonia's toxicity and the energy-intensive process required to separate nitrogen and hydrogen for energy uses pose challenges.
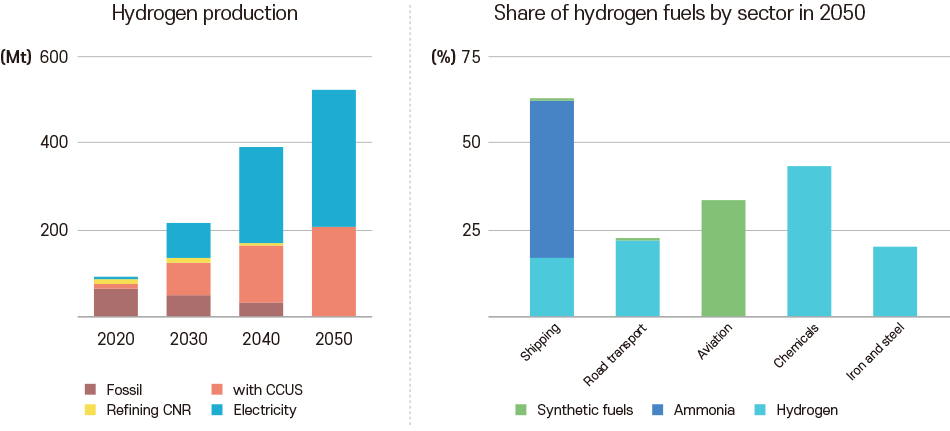
Sources: IEA
Liquefied Hydrogen Carriers
On the other hand, liquefied hydrogen offers the advantage of transporting hydrogen in a high-purity form, making it directly usable in industries that require hydrogen. However, it must be liquefied at a very low temperature of -253 degrees Celsius, which presents challenges. Compared to LNG, liquefied hydrogen experiences higher evaporation losses during transport and has a lower energy density per volume.
Hydrogen Transport Strategies in South Korea, Japan, and Europe
South Korea and Japan are currently at the forefront of the hydrogen economy, with parallel strategies for importing hydrogen. Initially, they plan to utilize ammonia as a transport medium due to its lower technological requirements. As advancements in liquefied hydrogen transport technology develop, both nations expect to use a dual approach, incorporating both ammonia and liquefied hydrogen. Meanwhile, Europe is also heavily involved in the hydrogen importation strategy, planning to supply a considerable portion of its hydrogen needs through ammonia imports. Europe is also preparing to establish large-scale plants capable of cracking the imported ammonia for further use. Concurrently, South Korea and Japan are preparing to import clean ammonia starting this year, primarily for blending in coal power generation, alongside expanding their port infrastructures to support these imports.
World ammonia demand outlook
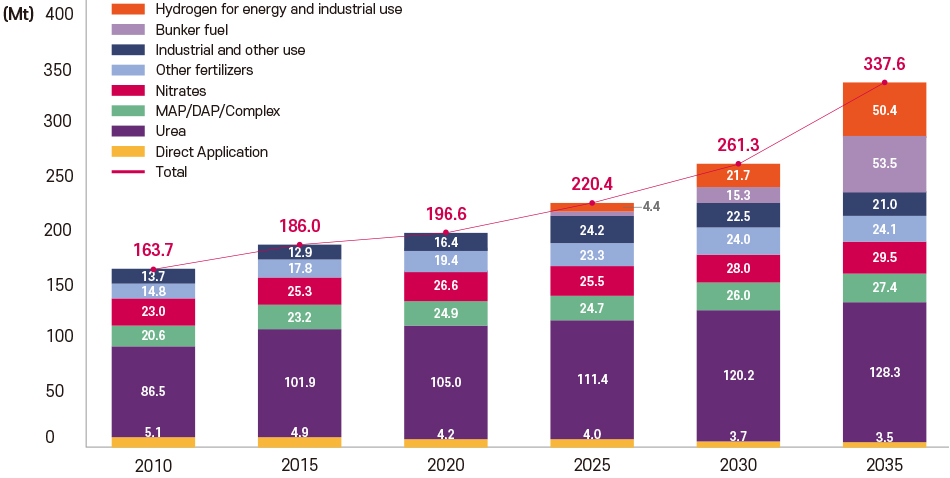
Source: S&P Global Commodity Insights, 2023.08.
Scaling Up Ammonia Carriers
When ammonia is used as a hydrogen transport medium between continents, traditional ammonia carriers, designed for transporting fertilizers with capacities between 80K to 90K, may not be sufficiently large for economical transport. Consequently, shipyards are now designing ultra large ammonia carriers with capacities ranging from 150K to 200K. If these supersized carriers are designed using the traditional method of independent Type A tanks, they face challenges such as the need to split tanks due to crane capacity limitations. Additionally, the increased weight and width associated with these tanks can complicate port entry and canal navigation. To address these issues, major shipyards are developing new concepts for cargo hold designs, in active collaboration with KR, to innovate and improve these designs.
Development of Liquefied Hydrogen Carriers: Korea and Japan
In the field of hydrogen transport, Japan's Kawasaki Heavy Industries has taken a pioneering step by building the world's first 1.25K class liquefied hydrogen carrier, the Suiso Frontier, which has successfully transported liquefied hydrogen from Australia to Japan. Kawasaki has announced plans to construct a 160K class liquefied hydrogen carrier by 2030. Meanwhile, South Korea is planning to build a 2.0K class liquefied hydrogen carrier by 2028, with ambitions to scale up to a 40K class by 2030 and eventually to more than 160K.
The strategic increase in capacity is crucial for the development of large-scale liquefied hydrogen carriers. This involves a step-by-step approach starting with pilot projects to test cargo hold technology, Boil-Off Gas (BOG) handling technology, and various equipment technologies. As the infrastructure for large-scale hydrogen production and liquefaction matures and the demand for hydrogen increases, the construction of commercial-sized liquefied hydrogen carriers becomes economically feasible. This growth is driven by the economies of scale in both supply and demand aspects.
In addition to the ongoing advancements in hydrogen transportation technology, regulatory frameworks are also evolving. The International Maritime Organization's Maritime Safety Committee (IMO MSC) was set to finalize interim guidelines for liquefied hydrogen carriers this year. However, as the South Korean government's proposal to include various cargo hold technologies beyond the Type C has been accepted by IMO MSC, the development of these guidelines is expected to be extended by approximately two to three years.
The Future Prospects of Hydrogen Transportation
The role of ammonia as a hydrogen transport medium appears increasingly secure. The existing volume of trade via sea and the well-developed port infrastructure make ammonia a robust candidate for hydrogen transport. This is further supported by the fact that ammonia can be used directly for power generation without the need for cracking back into hydrogen. Additionally, with the development of ammonia engines expected post-2025, its use as a ship fuel is likely to see significant growth.
Conversely, the path for liquefied hydrogen carriers is fraught with challenges. The construction of liquefied hydrogen plants and overcoming technical hurdles associated with the carriers themselves remain substantial. As a result, it is anticipated that hydrogen transport via ships will primarily utilize ammonia in the short to medium term, with liquefied hydrogen taking a dual-track approach as technology development and demonstration progress concurrently.
These developments highlight the dynamic nature of the hydrogen transport industry and underscore the importance of flexible regulatory and technological strategies to accommodate both current capabilities and future innovations.