Insights
KR Decarbonization Magazine
VOL.09 | WINTER 2024
Sailing Toward 2050 Decarbonization:
Pathways and Challenges for
GHG
Reduction in International Shipping
HA Seungman, Principal Surveyor of KR Machinery Rule Development Team

|
GHG Emission Reduction Mechanism in the 2023 IMO Strategy
The International Maritime Organization (IMO) established its 2023 GHG Strategy for the Reduction of GHG Emissions from Ships, setting the ambitious goal of achieving Net-Zero greenhouse gas (GHG) emissions by or around 2025 in the international shipping sector. To realize this objective, adopting sustainable marine fuels with near-zero lifecycle GHG emissions is critical. This can be achieved through mid-term measures, such as the Goal-based Marine Fuel Standard (GFS), which regulates the phased reduction of GHG intensity in marine fuels.
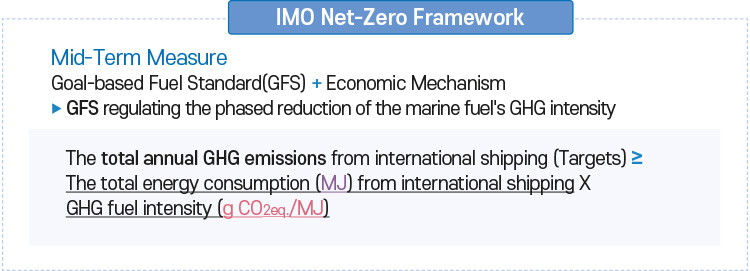
Among the mid-term measures discussed at IMO, GFS, as a technical measure, is closely related to the annual GHG emissions of international shipping. As illustrated below, the annual GHG emissions of international shipping can be calculated as the product of total energy consumption and GHG fuel intensity (g CO2eq./MJ). This calculation is based on a Well-to-Wake (WtW) perspective. While completely eliminating energy consumption is practically impossible, Net-Zero GHG emissions can be achieved by utilizing fuels with near-zero GHG intensity.
Mechanism of Annual GHG Emission Reduction Through GFS

Analysis of GHG Emission Reduction Pathways in the IMO 2023 Strategy
To establish clear emission reduction pathways aligned with the IMO 2023 strategy, it is essential to analyze the factors influencing GHG emissions in international shipping.
1. Calculation of Annual WtW GHG Emissions
The trajectory of annual GHG emissions in international shipping is assumed to be determined by two primary factors: total energy consumption and GHG fuel intensity (GHG Fuel Intensity).
1-1. Total Energy Consumption
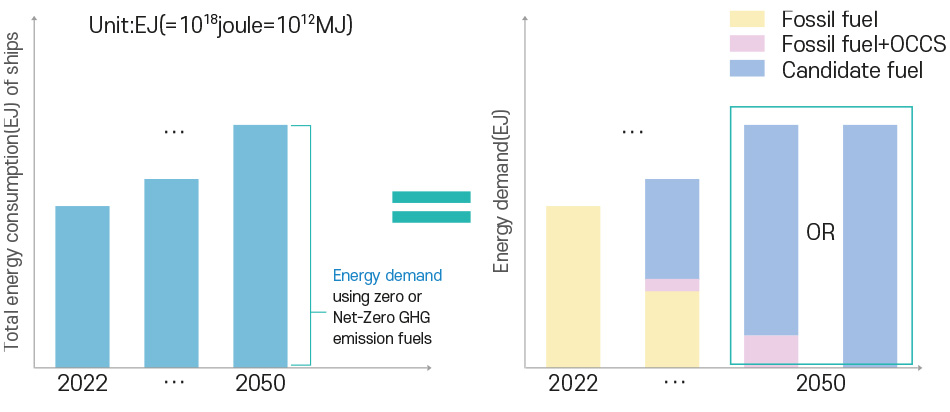
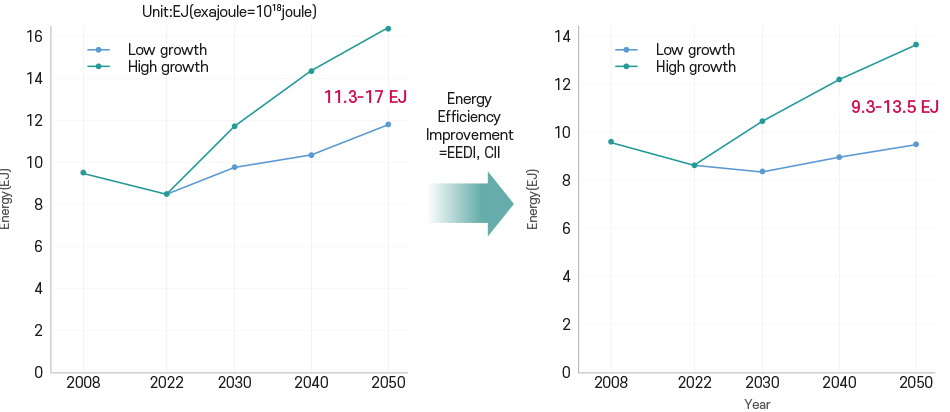
The left graph in Figure below illustrates the potential increase in total energy consumption driven by global trade expansion and the rising demand for international shipping. The graph on the right conceptually depicts the transition to sustainable fuels required to achieve Net-Zero GHG emissions by 2050. This transition is expected to occur as fossil fuels are gradually replaced with zero- GHG emission fuels or fossil fuels equipped with Onboard Carbon Capture Systems (OCCS). This suggests that the projected total energy consumption in international shipping will serve as a key indicator for assessing the future demand for alternative fuels.
Changes in Energy Consumption and Transition to Sustainable
Fuels in International Shipping
Based on the 2022 IMO DCS data, total energy consumption in international shipping was estimated using projections for transport work and assumptions regarding energy efficiency improvements.
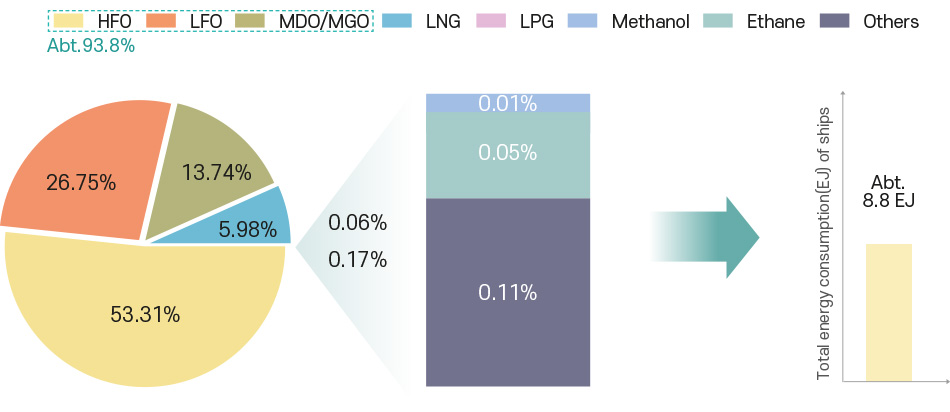
Baseline Year (2022) Energy Consumption: According to data from the IMO Data Collection System (DCS), the total energy consumption for the baseline year was approximately 8.8 EJ (10¹⁸ J). Of this, approximately 94% relied on fossil fuels, while alternative fuels accounted for a relatively small share.
Fuel Consumption in the IMO Data Collection System (DCS)
Projections for Transport Work: Using the low-growth scenario (OECD_RCP 2.6_G) and the high-growth scenario (SSP2_RCP2.6_L) from the 4th IMO GHG Study, transport work is projected to increase significantly by 2050. Compared to 2022 levels, the low-growth scenario assumes an increase of approximately 32%, while the high-growth scenario projects an increase of about 92%.
Assumptions on Transport Work Growth
| Scenarios | 2008 | 2018 | 2022 | 2030 | 2040 | 2050 |
|---|---|---|---|---|---|---|
| Low Growth (OECD_RCP 2.6_G) | 0.67 | 0.95 | 1.00 | 1.08 | 1.22 | 1.32 |
| High Growth (SSP2_RCP2.6_L) | 0.67 | 0.95 | 1.00 | 1.32 | 1.63 | 1.92 |
Energy Efficiency Improvements: Technological advancements and regulatory measures, such as the Energy Efficiency Design Index (EEDI) and the Carbon Intensity Indicator (CII), are projected to improve the energy efficiency of international shipping from approximately 30% in 2022 to 50% by 2050.
Assumptions on Energy Efficiency Improvement
| Year | 2008 | 2022 | 2030 | 2040 | 2050 |
|---|---|---|---|---|---|
| Improvement Rate | 0% | 29.95% | 40% | 45% | 50% |
1-2. Energy Consumption Projections in International Shipping
Projections for total energy consumption in the future are based on changes in transport work (considering both low-growth and high-growth scenarios) and energy efficiency improvements in the international shipping sector.
Under the high-growth scenario without energy efficiency measures, total energy consumption is estimated to reach up to 17 EJ by 2050. In contrast, with energy efficiency measures in place, total energy consumption is projected to decrease to between 9 EJ and 13.5 EJ, depending on the scenario. This indicates that energy efficiency improvements play a critical role in effectively reducing overall energy demand, especially given the limited availability of alternative fuels.
Projections for Energy Consumption Based on Efficiency Improvements
2. Annual WtW GHG Emission Targets
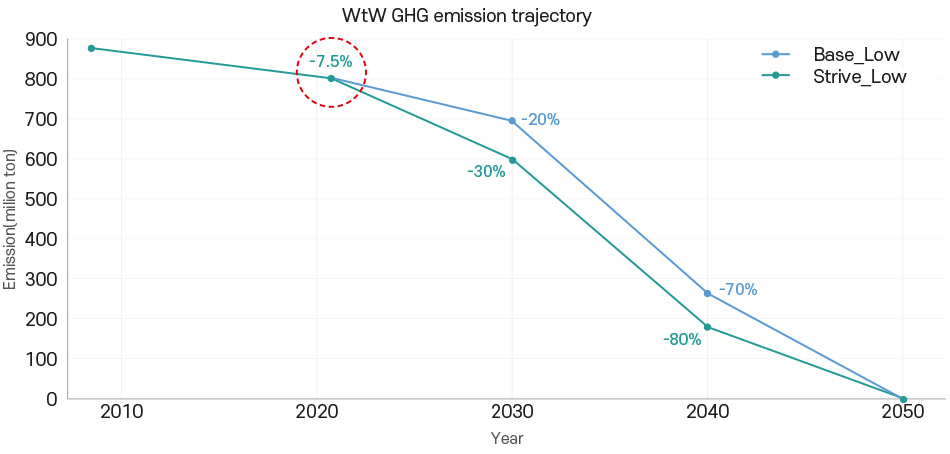
The IMO 2023 strategy sets out annual GHG emission reduction targets for 2030 and 2040, as shown in the figure below, based on 2008 as the baseline year.
Reduction Targets in the IMO 2023 Strategy

2008 WtT Emissions were calculated based on fuel consumption data (HFO, MDO, LNG) from the Third IMO GHG Study and emission factors from the FuelEU Maritime framework.
2008 TtW Emissions were derived using 2022 IMO DCS data, with retrospective estimation of 2008 transport work and energy efficiency levels (see Tables 1 and 2).
The analysis indicates that total emissions in 2022 were approximately 7.5% lower than in 2008, which implies that an additional 12.5% reduction is required to meet the 2030 target of 20% reduction.
Emission Reduction Targets Based on the IMO 2023 Strategy
The estimated WtW emissions for vessels above 5,000 GT in 2008 have direct implications for setting annual emission targets for 2030, 2040, and 2050 in international shipping. They also significantly affect the determination of GHG fuel intensity targets, with the following Year structural considerations:
If 2008 emissions are underestimated: More stringent GHG fuel intensity values will be required.
If 2008 emissions are overestimated: Relatively lenient GHG fuel intensity values may suffice.
Accurate calculation and assumptions for 2008 emissions are therefore essential for establishing fair and achievable targets that align with the IMO’s reduction strategy and regulatory framework.
3. GHG Fuel Intensity Requirements
The requirements for GHG Fuel Intensity (GFI) are currently under review as part of the technical measures in the IMO's mid-term measures. To achieve the GHG reduction targets outlined in the IMO strategy, it is essential to significantly reduce the GFI of international shipping. This pathway analysis underscores the urgency of reducing GFI and improving energy efficiency in the maritime sector.
GHG Emissions from International Shipping

Source: KR estimation / Source: KR estimation and 2023 IMO GHG strategy
BAU (Business as Usual) Emissions: The left graph in Figure 7 above illustrates the Well-to-Wake (WtW) emission trajectory under the BAU scenario, indicating a significant rise in emissions by 2050, particularly under the high-growth scenario.
Projected Emission Pathway under IMO 2023 Strategy Targets: The right graph visually represents how Goal-based Marine Fuel Standards (GFS) measures can reduce emissions to Net-Zero by 2050.
What Levels of Required WtW GFI are Necessary to Meet the Targets?
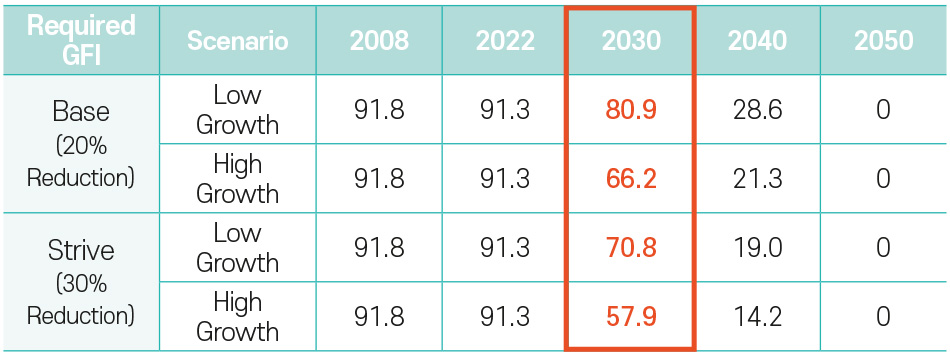
The figure below summarizes the required GFI values for key years (2030, 2040, 2050) under various scenarios and outlines a gradual reduction pathway toward achieving Net-Zero emissions by 2050.
Example of Required GFI Values Aligned with Reduction Targets
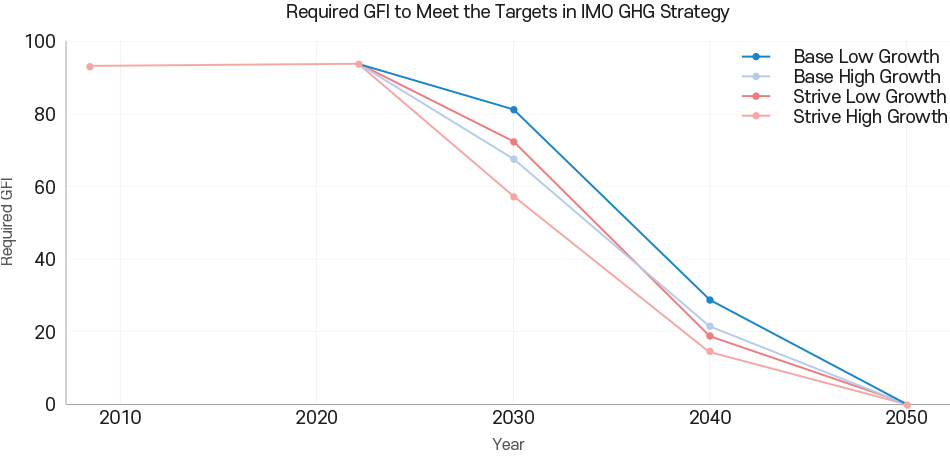

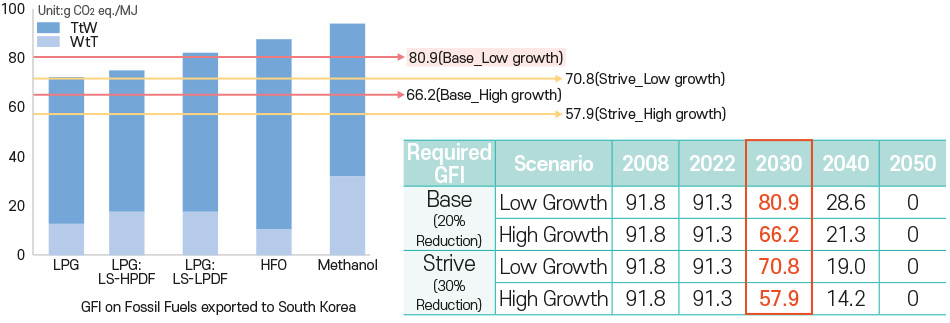
This analysis highlights the necessity of transitioning to low-carbon and zero- GHG emission fuels, particularly under high-growth scenarios. Below are the examples of Required GFI values for 2030.
· Base, Low Growth(20% reduction): The GFI target for 2030 is set at 80.9 g CO2eq./MJ, reflecting moderate transport work growth.
· Base, High Growth(20% reduction): Under high-growth scenarios, the 2030 GFI
target decreases to 66.2 g CO2eq./MJ, accounting for increased energy demand.
· Strive, Low Growth(30% reduction): For a 30% reduction target, the strive
scenario sets a 2030 GFI target at 70.8 g CO2eq./MJ.
· Strive, High Growth(30% reduction): Under high-growth conditions, the GFI
target further reduces to 57.9 g CO2eq./MJ by 2030.
The Required WtW GFI value of 80.9 g CO2eq./MJ derived under the lowgrowth scenario aligns closely with the Required WtW GFI value presented in Table 2 of the European/Japanese proposal document ISWG GHG 17/2/2 (Austria et al.). However, this value is slightly higher than the 2030 target set by FuelEU Maritime (85.69 g COg CO2eq./MJ), due to differences in 2050 targetsetting approaches. While the IMO aims for net-zero emissions, FuelEU Maritime targets an 80% reduction in WtW GHG intensity compared to 2020 levels.
Given the sensitivity of Required WtW GFI values to changes in transport work under low- and high-growth scenarios, a cautious approach and additional analysis based on realistic growth scenarios are necessary. It is expected that these considerations will be adequately reflected during the final review of reduction rates at the IMO MEPC 83rd meeting scheduled for March 2025.
The following figure compares the Required WtW GFI levels for 2030 under various scenarios with the GFI values of commonly used fossil fuels currently imported to South Korea. It includes LPG, LNG* (HPDF and LPDF), HFO, and methanol, set against the Required WtW GFI targets. The reduction targets are indicated by dashed lines: pink for the base scenario and yellow for the strive scenario. This comparison demonstrates the challenges of achieving the 2030 targets.
*HPDF : High-Pressure Dual-Fuel, LPDF: Low-Pressure Dual-Fuel
Comparison of Current Fossil Fuel GFI with Required WtW GFI for 2030
4. Scenario Analysis for Achieving the IMO GHG Strategy’s 2030 Targets
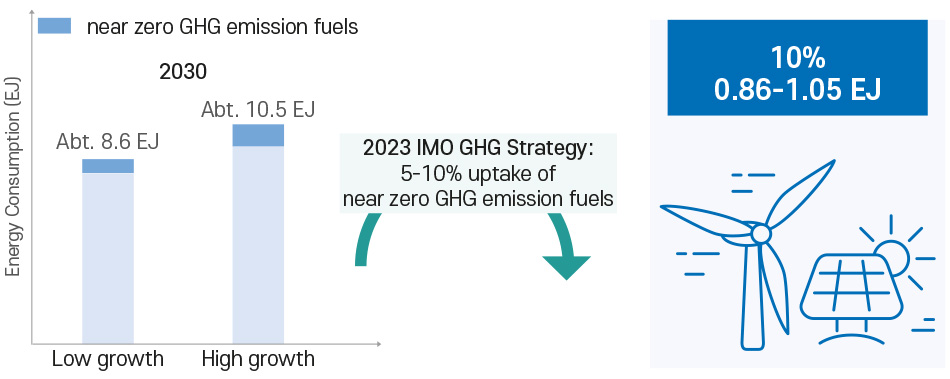
The IMO has committed to achieving Net-Zero emissions by 2050 while setting a near-term target to ensure that at least 5% (with a goal of 10%) of energy used in international shipping by 2030 is derived from zero or near-zero GHG emission fuels, energy sources, and technologies.

By 2030, the total energy consumption in international shipping is expected to reach approximately 8.6 EJ under the low-growth scenario and 10.5 EJ under the high-growth scenario. Under these conditions, achieving a 10% adoption of zero-GHG emission fuels would account for approximately 0.86 EJ (low-growth) to 1.05 EJ (high-growth) of total energy consumption. This necessitates a thorough examination of whether approximately 1 EJ of such fuels can be integrated into international shipping by 2030.
Required Zero-GHG Emission Fuels for Achieving the 2030 Target
To meet the IMO’s 2030 GHG reduction target (20%), it is essential to integrate zero-emission fuels such as biofuels and e-fuels into international shipping. This evaluation identified two key scenarios: ① Adoption of Near Zero GHG Emission Fuels, ② Improvements in Energy Efficiency.
As illustrated in the left graph of Figure 11, assuming zero-GHG emission fuels have an intensity of 5 g CO₂eq./MJ, their adoption at a 10% rate is projected to reduce total emissions in 2030 to approximately 708 million tons under the low-growth scenario. In contrast, total emissions in the highgrowth scenario would reach around 860 million tons. Both scenarios fall short of the 2030 reduction target of 694 million tons.
Scenario Analysis for Achieving the 2030 Target:
① Adoption of Near Zero GHG Emission Fuels, ② Energy Efficiency Improvements
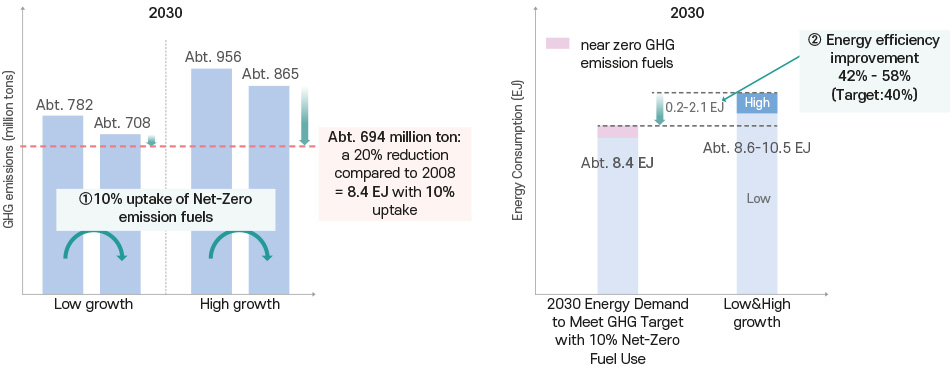
To achieve the 2030 reduction target, total energy consumption in international shipping should decrease from the projected range of 8.6 EJ to 10.5 EJ down to approximately 8.4 EJ. This requires further improvements in energy efficiency beyond the current 2030 target of 40% (refer to Table 2). These improvements would need to reduce energy consumption by approximately 0.2 EJ in the low-growth scenario and up to 2.1 EJ in the high-growth scenario. Based on the analysis, energy efficiency in international shipping should improve by approximately 42% to 58% by 2030.
Enhancing energy efficiency is likely to be achieved through advancements in vessel technology, optimized operational practices, and compliance with stringent regulations such as the Energy Efficiency Design Index (EEDI) and Carbon Intensity Indicator (CII). However, this analysis is based on 2022 IMO DCS data, and the results may vary due to transitional factors, such as the increased adoption of fossil-based LNG fuel post-2023.
Challenges and Opportunities for Achieving the 2030 GHG Reduction Targets in International Shipping
To meet the IMO's 2030 GHG reduction targets, international shipping should focus on two key pillars: the adoption of zero-GHG emission fuels and improvements in energy efficiency. This analysis highlights the critical role of changes in energy consumption and GHG fuel intensity in determining the feasibility of achieving the 2030 targets.
In both low-growth and high-growth scenarios, the rapid adoption of near-zero GHG emission fuels is essential to align current annual emissions with reduction targets. It is particularly urgent to evaluate the feasibility of fuel adoption by 2030 and implement the necessary policy and technological efforts to support it. Additionally, improving energy efficiency through the application of advanced technologies and optimized operational practices, such as EEDI and CII measures, will be necessary. These improvements are expected to further reduce energy consumption (for example, achieving efficiency gains of 42% to 58% by 2030).
However, it is important to note that this analysis is based on 2022 IMO DCS data and does not account for recent developments, such as the increased adoption of fossil-based LNG fuels after 2023. Moreover, estimates of 2008 WtW emissions and growth scenarios (e.g., changes in international transport work) can significantly impact the setting of annual emission reduction targets for 2030, 2040, and 2050.
Changes in transport work under low- and high-growth scenarios significantly impact total energy consumption, resulting in variability in the Required WtW GFI values needed to meet annual GHG emission targets. Given the high level of uncertainty associated with long-term transport work projections, it is essential to regularly review and monitor the Required WtW GFI values to ensure alignment with the IMO’s reduction targets.

When designing regulatory frameworks, the IMO should adopt a realistic approach that considers the readiness of the industry and the principles of sustainable development. It is expected that the IMO MEPC meeting scheduled for March 2025 will finalize reasonable and feasible regulations regarding the WtW GFI targets required for international shipping. These regulations should be designed to promote technological innovation and decarbonization while collaborating with the industry to achieve tangible climate change mitigation goals. Therefore, effective reduction strategies should be based on a cautious approach and realistic growth scenarios, supported by further research and analysis.
Achieving the 2030 targets represents a critical turning point for international shipping as it progresses toward the long-term goal of Net-Zero emissions by 2050. As a key stakeholder in the global shipping industry, KR is committed to providing actionable insights and technological solutions to support the achievement of both 2030 and 2050 targets.
KR will continue to accelerate decarbonization across the maritime industry by strengthening international cooperation and regulatory alignment, supported by data-driven analysis and innovative technology development.
Wind-Assisted Propulsion System
(WAPS) for Responding to International
Environmental Regulations (EEDI/EEXI, CII)
KIM Sangyeob, Senior Researcher of KR Ship & Offshore Technology Team

|
Introduction
The shipping industry, responsible for approximately 80% of global cargo transport, is facing increasing environmental pressure due to greenhouse gas (GHG) emissions. To address this issue, the International Maritime Organization (IMO) has implemented stricter GHG reduction regulations, including the Energy Efficiency Design Index (EEDI), the Energy Efficiency Existing Ship Index (EEXI), and the Carbon Intensity Indicator (CII), while pursuing gradual tightening of these standards. The first step to comply with these regulations is to limit engine output and reduce vessel speed; however, this approach can negatively impact the cargo transport efficiency and commercial competitiveness of ships. Therefore, the adoption of Innovative Energy Efficiency Technologies (EETs) that meet environmental standards while maintaining target speeds is essential. This article introduces the Wind-Assisted Propulsion System (WAPS) as a practical, forward-looking solution for improving fuel efficiency and achieving decarbonization in the shipping industry.
WAPS
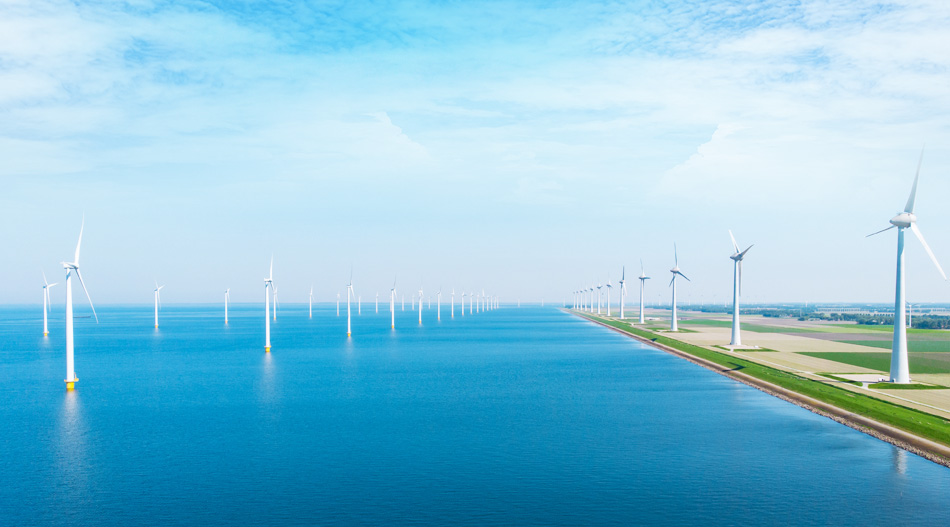
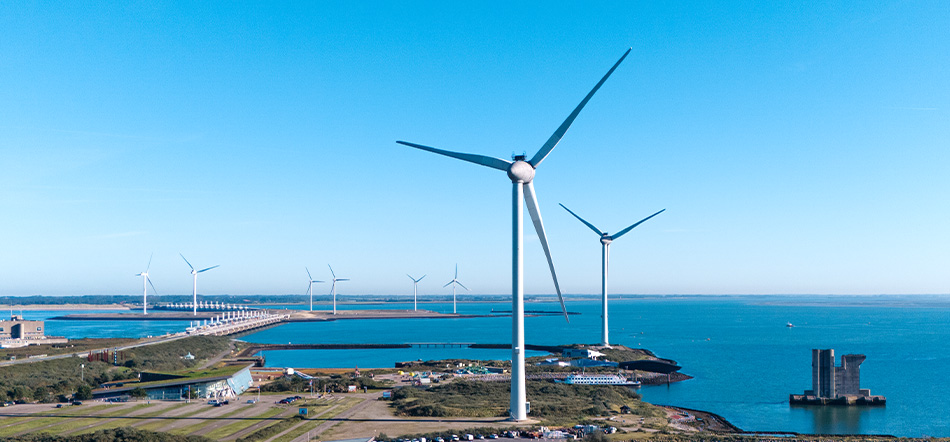
The Wind-Assisted Propulsion System (WAPS) is a technology that harnesses wind energy to generate propulsion for ships, with performance varying significantly depending on wind direction and speed during operation. WAPS includes various types such as soft sails, hard sails, and rotor sails. Recently, hard sails, often referred to as wing sails, and rotor sails have gained notable attention. Hard sails generate forward propulsion by adjusting the angle of attack, creating a velocity difference around the sail. Their performance depends largely on the cross-sectional shape of the sail. Rotor sails, on the other hand, utilize a rotating cylindrical sail to induce a velocity difference in the airflow around the sail, generating propulsion through the Magnus effect. Both hard sails and rotor sails share a similar characteristic in that they achieve propulsion by controlling airflow around the sails. The thrust generated by WAPS is heavily influenced by the system's wind projected area, or the area exposed to wind. Hard sails generally have a larger installation area compared to rotor sails, making them well-suited for large vessels. Conversely, rotor sails, despite being relatively compact, offer a high thrust-to-size ratio, making them an efficient choice for vessels with limited deck space. When adopting WAPS, it is essential to comprehensively evaluate factors such as the ship's design and operational characteristics, the required thrust level, the available deck space, and the size of the system that can be installed.
Additionally, several technical challenges must be addressed during the design and implementation of Wind-Assisted Propulsion Systems (WAPS). First, the sail shape (crosssectional profile and aspect ratio) has a direct impact on thrust efficiency. It must be optimized to maximize the effective utilization of wind energy. Second, when multiple sails are installed, interference effects between the sails may occur, which can reduce overall thrust efficiency. Therefore, precise positioning and configuration of the sails are essential to mitigate such effects. Third, vortex shedding around the sails may cause resonance, which could negatively affect structural stability and operational safety. This potential risk requires thorough analysis and careful consideration during the design phase.
Performance Evaluation of WAPS in terms of Green House Gas Regulations
The International Maritime Organization (IMO) uses key indicators, such as the Energy Efficiency Design Index (EEDI) and the Carbon Intensity Indicator (CII), to evaluate environmental compliance. These indicators serve as benchmarks for assessing a ship's design and operational efficiency, respectively. EEDI calculates a vessel's energy efficiency during its design phase under standardized conditions, including calm seas, fixed draught, and specific power output. It focuses primarily on evaluating the efficiency of design technologies and equipment. However, EEDI has limitations as it does not account for operational improvements or variations due to different sea states, operating conditions, or slow steaming strategies. On the other hand, CII assesses the annual average energy efficiency of a ship based on actual operational data. It evaluates real-world fuel consumption and CO2 emissions across various draughts, speeds, and sea states.
As a result, CII performance can vary significantly depending on the ship's operational strategies and management, even for vessels with identical designs. While EEDI emphasizes static, design-based performance and is suited for regulatory compliance during the construction phase, CII highlights the importance of continuous improvement and management of operational efficiency. This makes CII a dynamic metric aligned with IMO's long-term decarbonization goals.
Principles of EEDI/EEXI and CII calculation
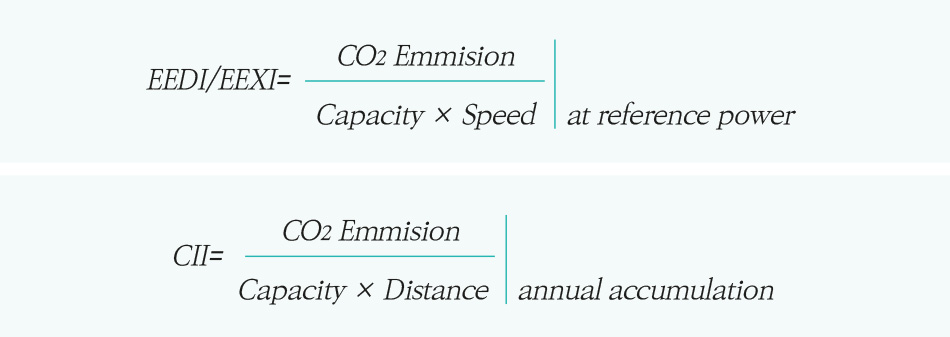
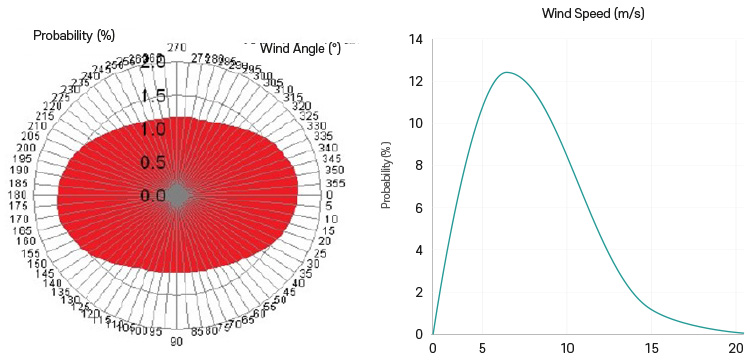
Due to these differences, the energy-saving performance of WAPS is quantified differently under EEDI and CII frameworks. For EEDI, the performance of WAPS is evaluated based on the expected reduction in main engine power achieved through its implementation. This evaluation relies on calculating a weighted average using the Global Wind Probability Matrix, which accounts for variations in wind speed and direction. This approach is considered a reasonable method for addressing the performance fluctuations of WAPS under different wind conditions. To derive the weighted average, it is necessary to estimate the thrust generated by WAPS for each wind speed and direction condition defined in the Global Wind Matrix. Typically, such estimations are performed using model testing or Computational Fluid Dynamics (CFD) simulations. These methods provide reliable data to quantify WAPS performance for EEDI compliance.
Wind properties of global shipping route
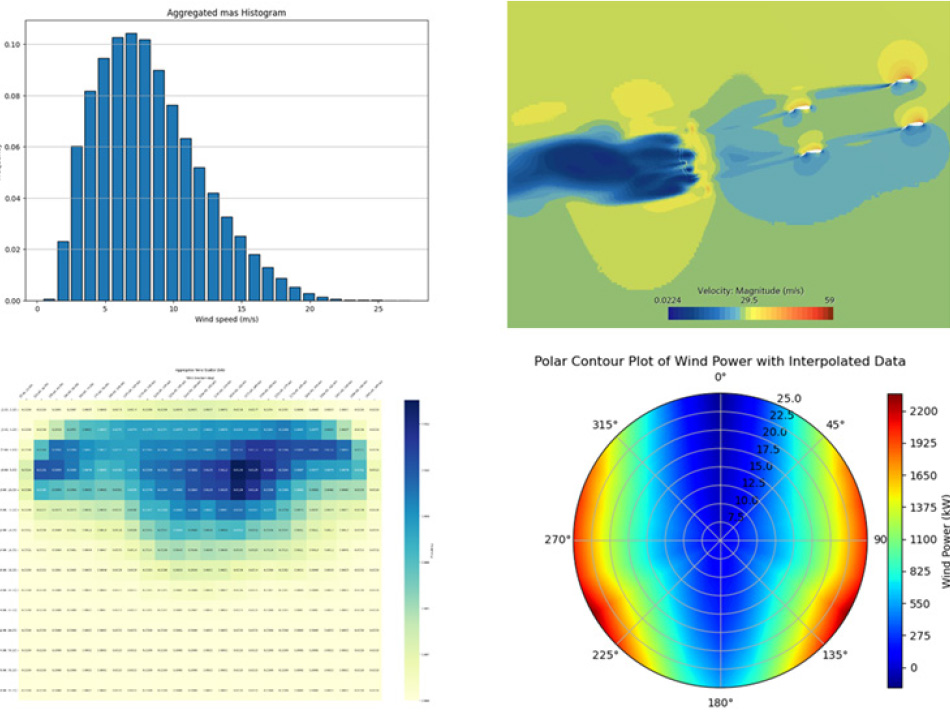
Since CII evaluates a vessel's energy efficiency based on actual operational data, it does not directly quantify the impact of WAPS on the overall energy efficiency of the ship, unlike EEDI. Therefore, when considering the adoption of WAPS for compliance with CII regulations, it is more effective to focus on the specific operational routes of the vessel rather than relying on the Global Wind Probability Matrix used in EEDI assessments. To achieve this, it is advisable to evaluate the fuel-saving potential of WAPS by taking into account the wind approach enables an accurate estimation of WAPS performance in real-world operating conditions. Consequently, such an approach can provide valuable insights into how WAPS contributes to CII compliance and supports practical regulatory adherence.
KR’s Developments of WAPS Technology
KR is actively leading the decarbonization of the shipping industry and conducting various research activities related to WAPS to provide professional technical services to its clients. One of the key methods for evaluating WAPS performance is Computational Fluid Dynamics (CFD), which, despite its importance, can yield varying results depending on the methodology and conditions applied. To overcome this limitation and enhance the reliability of CFD techniques, KR is collaborating with HD Hyundai Heavy Industries on a joint project to develop a "Numerical Simulation Guideline for Energy Efficiency Technologies (EETs) for EEDI Calculation." The draft of this guideline, designed to provide consistent and reliable evaluation standards for energy-saving devices—including WAPS—defined by IMO, is set to be published in 2025.
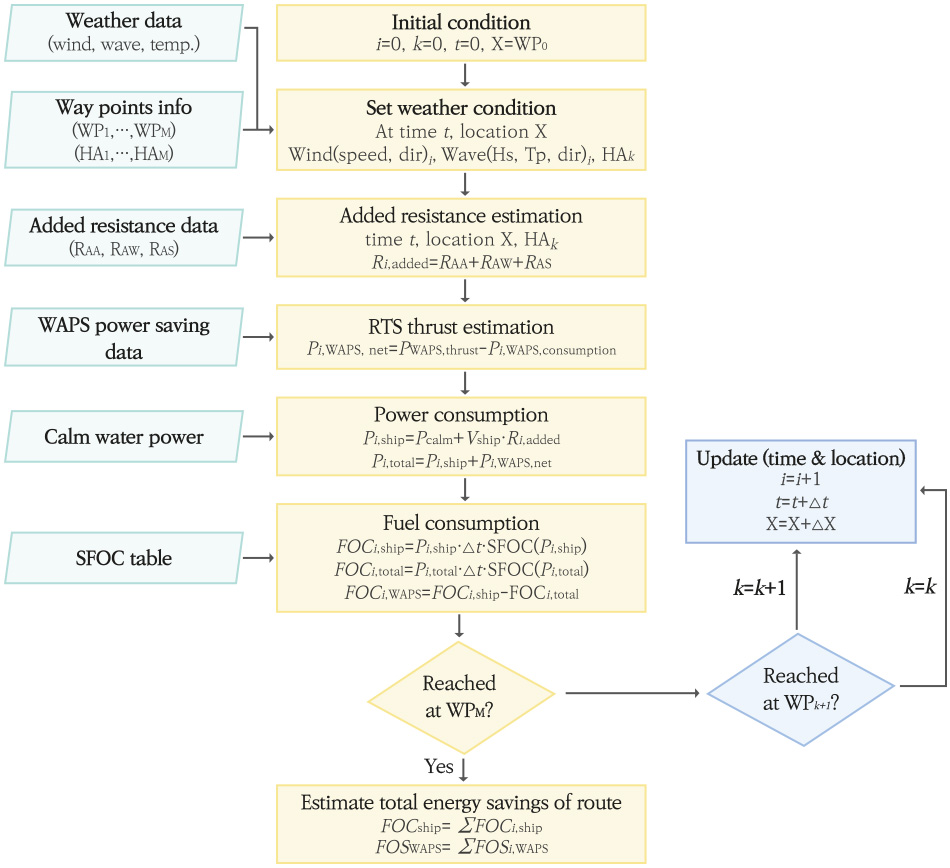
In addition, KR has established its own CFD-based performance analysis methods for key WAPS technologies, such as wing sails and rotor sails. Using tools like the Global Wind Probability Matrix, KR has developed techniques to calculate the average fuel-saving potential of WAPS and to quantify their impact on EEDI calculations or determine reward factors under the FuelEU Maritime framework. KR has further leveraged its Global Environmental Database (1940–2024) to create methodologies for estimating the energy-saving performance of WAPS under historical conditions for specific routes and timeframes. This approach enhances the accuracy and reliability of WAPS performance predictions in real operational environments. These methodologies go beyond simple aerodynamic analysis of WAPS to include comprehensive evaluations of ship resistance, added wave resistance, and propulsion performance. To continuously improve this integrated approach, ongoing research and development of key technologies are being conducted. Through these efforts, KR provides practical and reliable solutions to its clients, contributing to compliance with IMO regulations and meeting the demands of a sustainable shipping industry.
Evaluation of power saving performance of WAPS based on CFD
Flowchart of route-based WAPS performance evaluation procedure
