Insights
KR Decarbonization Magazine
VOL.10 | MAY 2025

IMO Net-Zero Framework:
A New Paradigm for the Shipping Industry
HA Seungman, Principal Surveyor of KR Machinery Rule Development Team

|
The international shipping industry is at a critical turning point as it faces mounting pressure to address climate change and transition to a low-carbon future. With the adoption of mid-term GHG reduction measures, including a carbon levy, at the 83rd session of the International Maritime Organization's (IMO) Marine Environment Protection Committee (MEPC 83) held in April, a significant portion of the regulatory uncertainty that has long hindered new shipbuilding orders and alternative fuel choices has been resolved.
These measures are set to enter into force in 2027 and will be fully implemented starting in 2028, applying to ships of 5,000 GT or more worldwide. This marks a critical milestone as the regulations will be enforced based on GHG Fuel Intensity (gCO2eq/MJ), fundamentally changing the landscape for international shipping.
Notably, this new framework represents a significant departure from the traditional single-target approach, introducing a Two-Tier Approach consisting of a Base Target and a Direct Compliance Target. This structure not only focuses on reducing GHG emissions but also creates a direct financial incentive for emission reductions, rewarding ships that achieve ambitious targets while imposing penalties or taxes on those that fall short.

① Base Target
· Ships that exceed the Base Target must either pay USD 380 per tonne of excess CO2 (Tier 2 RU price) or purchase Surplus Units (SUs) at market prices to offset their emissions and comply with the Base Target.
② Direct Compliance Target
· For emissions that fall between the Base Target and the Direct Compliance Target, a lower fee of USD 100 per tonne of excess CO2 (Tier 1 RU price) is imposed. This amount is allocated to the IMO Net Zero Fund and is considered as meeting the Direct Compliance Target.
③ Formation of the IMO Net Zero Fund
· The revenues collected from Base Target and Direct Compliance Target penalties (Items 1 and 2) are pooled into the IMO Net Zero Fund. This fund is used for a variety of purposes, including rewarding Zero or Near Zero (ZNZ) fuels and supporting a just transition within the maritime industry.
④ Incentive Structure
· Ships that meet the Direct Compliance Target can gain additional economic benefits by selling their surplus units (SUs) at market prices to ships that exceed the Base Target.
· Vessels using Zero or Near Zero (ZNZ) fuels can receive additional rewards, providing further economic incentives for deeper decarbonization efforts.
This framework highlights that the focus of GHG regulations is no longer limited to fuel choice alone but now includes the overall energy efficiency of the ship itself as a critical component. Notably, under the stricter targets, ships will be required to reduce their GHG fuel intensity by 43% by 2035 and by 65% by 2040, reflecting increasingly ambitious reduction goals.
This shift represents a fundamental change for the maritime industry, requiring rapid and significant fleet renewal and innovative fleet management strategies to meet these aggressive decarbonization targets.
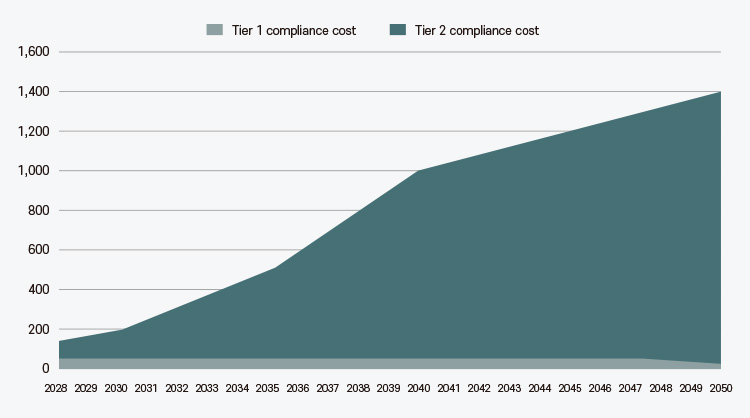
As illustrated in the figure below, ships that continue to use Very Low Sulfur Fuel Oil (VLSFO), which is typically considered to have a GHG Fuel Intensity (GFI) of 95.5 gCO2eq/MJ, are likely to face substantial compliance costs. By 2028, these costs are projected to reach up to USD 140 per ton of fuel, and by 2050, they could exceed USD 1,400 per ton, depending on market conditions.
The use of the term "up to" reflects the maximum potential cost if a ship fails to meet the required targets, forcing it to purchase Remedial Units (RU) at the Tier 2 price of USD 380 per tonne of CO₂, or alternatively, pay an equivalent amount for Surplus Units(SUs) at market rates. This implies that by 2050, these costs could potentially be three times the current average price of VLSFO, placing a significant economic burden on non-compliant vessels
Additionally, even when using the same Heavy Fuel Oil (HFO), significant differences in energy efficiency exist between older and newer vessels, leading to substantial variations in compliance costs. According to the IMO's mid-term measures impact assessment, ships built after 2025 are, on average, 25-32% more fuel-efficient than those built before 2015, resulting in proportionately lower annual GHG emissions.
This efficiency gap is reflected in the compliance calculations outlined in the Regulation 36 amendment of the IMO Net-Zero Framework, as approved at MEPC 83:
Annual Compliance Balance =
(Required Annual GHG Intensity- Attained Annual GHG Intensity) × Total Energy Used
The Annual Compliance Balance is a critical metric that measures how far a vessel deviates from its regulatory target, expressed in tonnes of CO2. The larger the total energy used, the greater the compliance cost, as it is calculated by multiplying this balance by the applicable carbon pricing rate (e.g., 380 USD/tCO2, 100 USD/tCO2, or the market price of Surplus Units (SUs)).
This means that simply choosing low-carbon fuels is not sufficient for compliance. Ships must also optimize their overall energy efficiency to minimize both short-term fuel costs and long-term regulatory compliance expenses. In other words, reducing the attained GHG intensity through more efficient fuel use and vessel design improvements is essential not only for immediate cost savings but also for sustained competitiveness in a carbon-regulated market.
The needs for Familiarization with Marginal Abatement Costs (MAC)
The IMO Net-Zero Framework requires not only emission reductions but also strategic decision-making on the most cost-effective pathways to regulatory compliance. A critical concept in this process is the Marginal Abatement Cost (MAC), which measures the cost of reducing an additional tonne of CO2. It serves as a key economic indicator for evaluating the viability of different fuels and technologies in meeting the required GHG reduction targets.
Under the current IMO framework, the cost of compliance varies depending on the GHG intensity of the fuel used:
· Tier 1: 100 USD per tonne of CO2
· Tier 2: 380 USD per tonne of CO2
· Surplus Unit (SU) Prices: Expected to fluctuate within this range, depending on market dynamics.
However, it remains uncertain whether these regulatory costs are sufficient to encourage widespread adoption of Zero or Near-Zero (ZNZ) fuels, such as e-fuels, given their higher production costs.
According to a 2022 MIT study, the MAC for replacing fossil fuels with renewable e-fuels ranged from 599 to 1,520 USD per tonne of CO2 in 2020. With substantial investment in technology and production capacity, this cost is projected to decrease to 57 to 557 USD per tonne of CO2 by 2050. However, even this reduced range is still significantly higher than the current Tier 1 and Tier 2 compliance costs, suggesting that a pure regulatory price signal may not be sufficient to drive the large-scale adoption of e-fuels in the near term.
The IMO Net-Zero Framework was adopted through a Two-Tier Approach that reflects the diverse perspectives of its member states, representing a significant political and policy compromise. This structure requires continuous monitoring of the impact these regulatory costs have on the global shipping market. In particular, ship operators must carefully assess whether the fines, taxes, or financial rewards set by the IMO adequately compensate for the Marginal Abatement Costs (MAC) associated with different fuel types. Additionally, the evolving dynamics of the fuel supply market will play a critical role in shaping these strategic decisions.
Ultimately, shipowners must make strategic choices about whether it is more cost-effective to switch to alternative fuels or simply pay the associated compliance costs. To make this decision, several scenarios should be carefully considered:
· Meeting the Base Target: Should a ship exceed the Base Target, it will need to cover both Tier 1 (100 USD/tCO2) and Tier 2 (380 USD/tCO2) compliance costs, or alternatively, aim to meet the Base Target to avoid the higher Tier 2 charges.
· Exceeding the Direct Compliance Target:Ships that can achieve or surpass the Direct Compliance Target may be able to avoid both Tier 1 and Tier 2 charges entirely. Alternatively, they may choose to exceed these targets further, potentially earning additional financial rewards or surplus units (SUs) that can be sold on the market.
Biofuel Case Study
The following table provides an example of whether it is more advantageous to meet the Base Target or the Direct Compliance Target when using biofuels. This analysis is based on April 2025 Singapore market prices and the GHG intensity of UCOM biofuels. VLSFO is included as a typical fossil fuel benchmark, while B30 and B100 represent alternative biofuels with different blending ratios.
| Fuel type | Price(USD/ton) | LHV(MJ/ton) | Attained GFI (gCO2eq/MJ) |
|---|---|---|---|
| VLSFO | 481 | 40200 | 40200 |
| B30 | 740 | 39390 | 70.63 |
| B100 | 1143 | 37500 | 8.3 |
The Marginal Abatement Cost (MAC) is calculated using the following formula:
- MAC=GHG Emission Reduction / Fuel Price Difference
Applying this formula, the MAC for each fuel type is as follows:
· B100: 212 USD/tCO2
· B30: 274 USD/tCO2
Since the MAC for B100 is lower than that for B30, this analysis will use B100 as the primary example to illustrate the economic viability of meeting compliance targets.
Total compliace cost(USD/ton HFO eq)
Cost Analysis Results
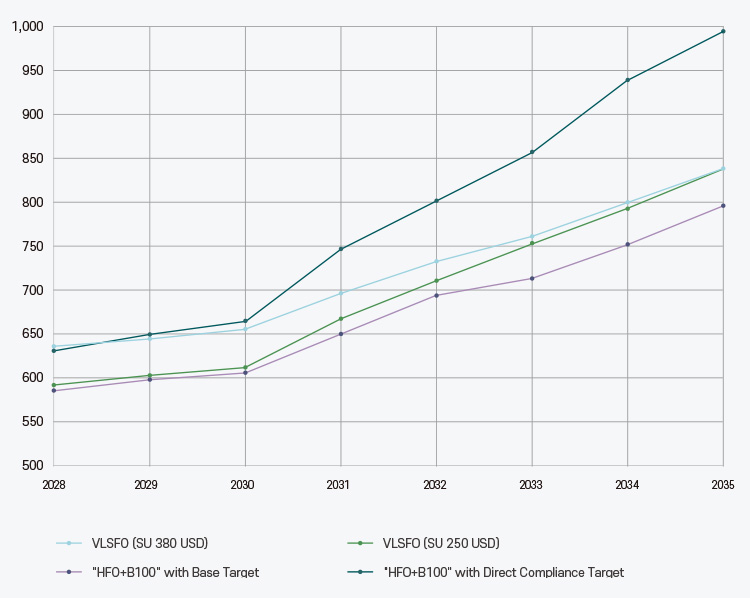
· The MAC for B100 is 212 USD/tCO2, which can be more economical than paying the Tier 2 compliance cost of 380 USD/tCO2. However, in the Tier 1 range, where the compliance cost is 100 USD/tCO2, the cost advantage of B100 may be limited, highlighting the importance of careful strategic planning.
· In scenarios where SU trading benefits and ZNZ fuel incentives are not considered, the HFO + B100 (Base Target) scenario (green) can be more advantageous than the HFO + B100 (Direct Compliance Target) scenario (purple).
· The total compliance cost, including fuel costs, can vary significantly depending on the market price of SUs. For example, if the SU price is USD 250 (red) versus USD 380 (blue), the overall cost structure changes. In general, vessels that exceed the Base Target are likely to choose to buy carbon credits at lower market prices (e.g., USD 250) rather than pay the maximum 380 USD/tCO₂ compliance fee.
However, it is important to note that this analysis does not yet account for potential rewards for Zero or Near Zero (ZNZ) fuels, which the IMO is expected to finalize by March 1, 2027. The level of these rewards could significantly impact the cost-effectiveness of exceeding the Direct Compliance Target, making it a critical factor in future compliance strategies.

Need for Comprehensive Response Strategies and Long-Term R&D Planning
The IMO Net-Zero Framework represents more than just a regulatory shift; it marks a fundamental transformation in the maritime industry, requiring long-term investments in technology and fuel transition to maintain competitiveness. This Two-Tier structure, based on the Base Target and Direct Compliance Target, emphasizes the need for not only emissions reductions but also broader energy efficiency improvements.
To effectively navigate this changing regulatory landscape, shipping companies must establish comprehensive, long-term strategies that address both near-term costs and long-term regulatory risks, including securing reliable green fuel supplies, expanding the use of clean technologies, implementing digital GHG intensity monitoring systems for each fleet, and developing integrated financial strategies that account for fluctuating compliance costs.
Given that these regulations are also being reinforced by regional initiatives like the EU's FuelEU Maritime and Emissions Trading System (ETS), the risk of double or triple regulatory costs is growing. This is particularly critical for older, less fuel-efficient vessels, which face a higher risk of being pushed out of the market.
Therefore, investing in sustainable technologies and integrating these advancements into fleet management will be essential for long-term competitiveness in the emerging net-zero maritime market.

Response to Global Greenhouse Gas Emission Regulations: Strategic Choices and Future Prospects of Ship Energy Saving Technologies
박현석 책임, KR 기관규칙개발팀

|
Current climate change is progressing much more rapidly than previously predicted by the international community, affecting various industries worldwide. Particularly, the maritime industry is undergoing significant changes to meet the societal demand for 'decarbonization.' As a result, international regulations on greenhouse gas emissions and air pollutants are tightening, with active discussions focused on the development of eco-friendly ship design technologies, the establishment of integrated digital platforms to enhance operational efficiency, and the use of alternative eco-friendly fuels.
Recently, the International Maritime Organization (IMO) announced a firm target to achieve 'net-zero' greenhouse gas emissions by 2050 for the international shipping sector. This sets an important benchmark for the sustainable development of the shipping industry and indicates that international carbon emission regulations will likely become even stricter in the future. These changes provide shipping companies the opportunity to reconsider their existing operational practices and adopt new technologies.
Additionally, the IMO, as part of the results from the 83rd MEPC session in April 2025, adopted the 'Greenhouse Gas Fuel Intensity (GHG Fuel Intensity, GFI)' regulation as a candidate mid-term measure for greenhouse gas reduction. This provides shipping companies with the opportunity to devise swift and effective responses. At the same time, there is a deep focus on introducing energy-saving technologies that improve actual fuel efficiency during operation. While there is an extensive range of vessel energy-saving technologies currently in development, the practical response strategies to regulatory frameworks like EEDI (applicable to new ships) and EEXI (applicable to existing ships), enforced by the MEPC for international navigational vessels, remain quite limited. These technologies are outlined in MEPC.1/Circ.896, and shipping companies need to consider various constraints when applying them to their fleets.
This article aims to provide useful information that can help shipping companies strategically adopt energy-saving technologies to achieve successful outcomes. It will present valuable insights from various perspectives, including the types of energy-saving technologies, energy-saving mechanisms, the effectiveness of responding to greenhouse gas regulations through technology , and future economic viability projections.

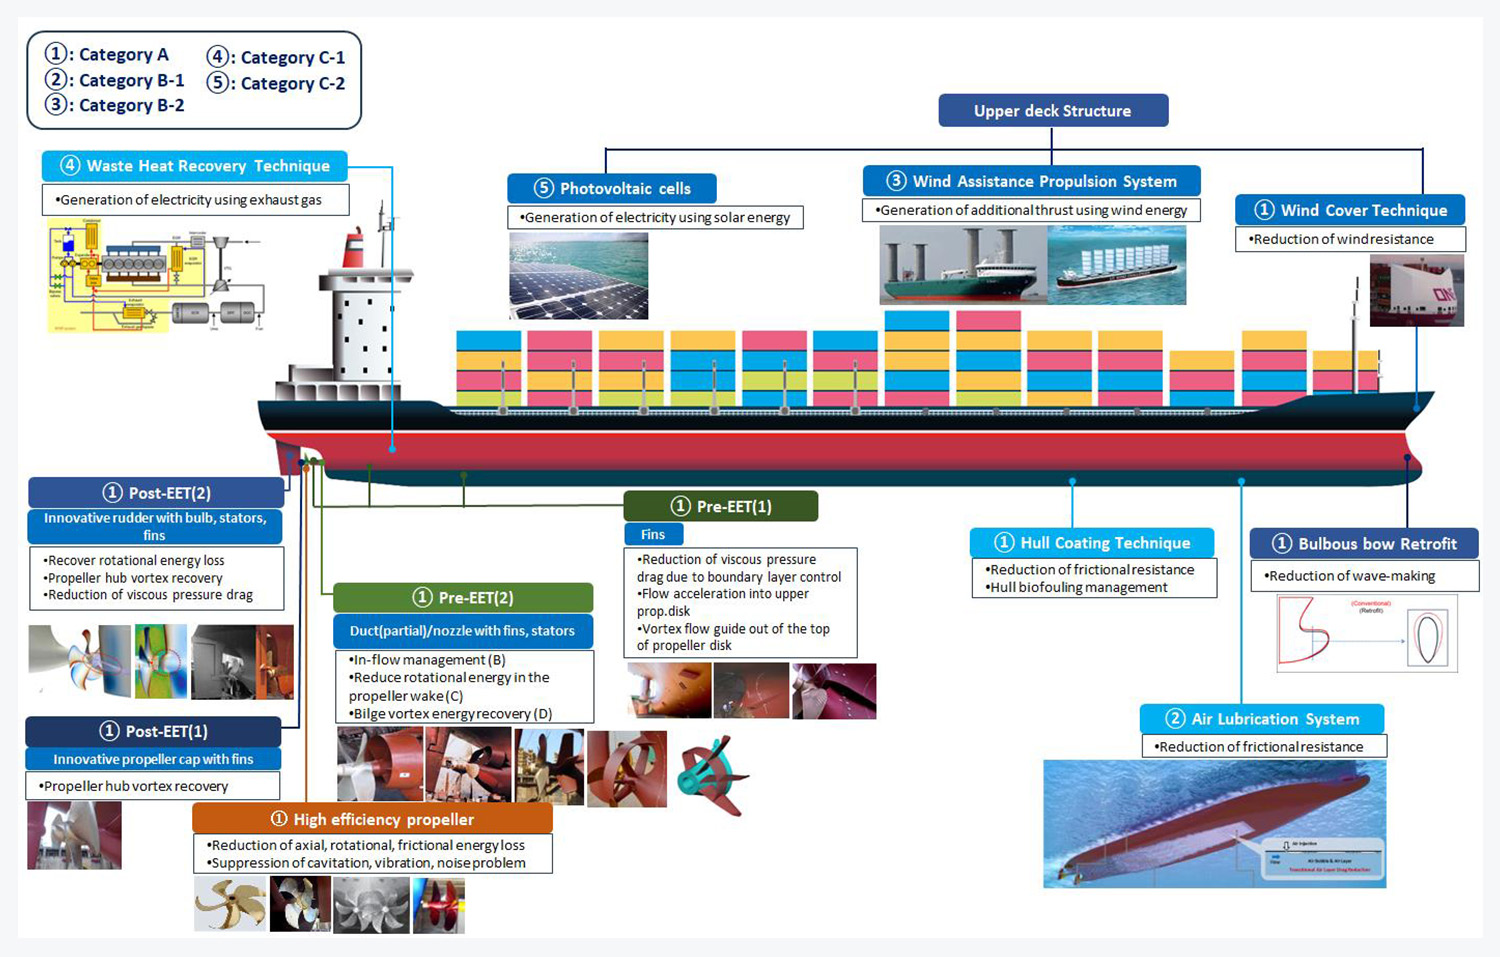
Categorization of Energy-Saving Technologies under MEPC
At its 77th session in November 2021, the MEPC approved the 2021 Guidelines (“2021 Guidance on Treatment of Innovative Energy Efficiency Technologies for Calculation and Verification of the attained EEDI and EEXI”) for the calculation and verification of the attained values for EEDI/EEXI. Consequently, the MEPC distributed document MEPC.1/Circ.896 to the administrations of member states, industry stakeholders, relevant shipping organizations, shipping companies, and other interested parties.
Categories of Energy Efficiency Technologies according to MEPC.1/Circ.896
| Inive Energy Efficiency Technologie | ||||
|---|---|---|---|---|
| Reduction of Main Engine Power | Reduction of Auxiliary Power | |||
| Category A | Category B-1 | Category B-2 | Category C-1 | Category C-2 |
| Cannot be separated from overall performance of the vessel | Can be treated separately from the overall performance of the vessel | Effective at all time | Depending on ambient environment | |
| feff = 1 | feff < 1 | feff = 1 | feff < 1 | |
| · Low Friction Coating · Bare Optimization · Rudder Resistance · Propeller Design |
Hull Air Lubrication System (air cavity via air injection to reduce ship resistance) (can be switched off) |
Wind Assistance (sails, Flettner-Rotors, kites) |
Waste Heat Recovery System (exhaust gas heat recovery and conversion to electric power) |
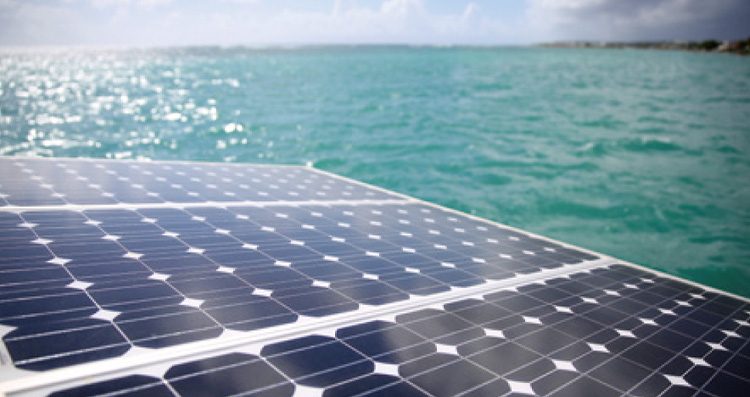
Photovoltaic Cells |
The major roles of the innovative energy-saving technologies categorized under MEPC.1/Circ.896 for the calculation of EEDI/EEXI are summarized as follows:
· Category A: Technologies that shift the power-speed curve, altering the combination of propulsion power (Pp) and
reference speed (Vref)
-This category primarily includes Propulsion Improvement Devices (PID), which achieve energy savings mainly through flow control. It also encompasses technologies that directly reduce viscous resistance, such as fins, low-friction coatings, and air resistance reduction techniques through superstructure optimization
· Category B: Technologies that reduce Pp at a fixed Vref without generating electricity
-Category B-1: Technologies that can be used regardless of weather conditions during vessel operation, with an availability factor (feff) set at 1.0 (applicable at all times)
-Category B-2: Technologies that can only be utilized at maximum output under limited wind conditions, with the availability factor (feff) applied at less than 1.0 (weather-dependent)
· Category C: Technologies that generate electricity, reducing energy consumption from auxiliary engines, with the reduced energy being calculated independently.
-Category C-1: Technologies that can be used regardless of weather conditions during vessel operation, with an availability factor (feff) set at 1.0 (applicable at all times)
-Category C-2: Technologies that can only be utilized at maximum output under limited conditions (e.g., sunlight), with the availability factor (feff) applied at less than 1.0 (weather-dependent)
Energy-saving technologies classified as PID (Propulsion Improvement Device) in Category A can be further categorized based on their installation location. They can be classified into: energy-saving technologies installed forward of the propeller (Pre-EET), high-efficiency propellers, and energy-saving technologies installed aft of the propeller (Post-EET).
The Principal Concepts and Mechanisms of Representative Energy Efficiency
Technologies as Categorized in MEPC.1/Circ.896

Energy-Saving Technologies and EEDI/EEXI
The IMO agreed to distribute MEPC.1/Circ.815 (“2021 Guidance on Treatment of Innovative Energy Efficiency Technologies for Calculation and Verification of the attained EEDI”) through the MEPC 65th session (2013). Subsequently, prior to the enforcement of EEXI (effective January 1, 2023) as a short-term measure for reducing greenhouse gas emissions from vessels, the IMO revised MEPC.1/Circ.815 at the MEPC 77th session (2021) to encompass EEXI, distributing MEPC.1/Circ.896 (“2021 Guidance on Treatment of Innovative Energy Efficiency Technologies for Calculation and Verification of the attained EEDI and EEXI”) to member states and stakeholders.
For the EEDI, to apply energy-saving technologies and obtain approval from a Recognized Organization (RO), the guidelines of IACS Procedural Requirement No.38-Rev.4 must be followed. This requirement details the procedures for all activities in which the classification society is involved during the inspection and certification of EEDI, as per the regulations 5, 6, 7, 8, and 9 of MARPOL Annex VI. Conversely, it's important to note that the application of EEXI is governed differently by Resolution MEPC.335(76), MEPC.350(78), MEPC.351(78), IACS Recommendation No.172-Rev.1 (revised in April 2024), and IACS Recommendation No.173.
EEDI/EEXI Calculation Formula Referred to Resolution MEPC.333(76)
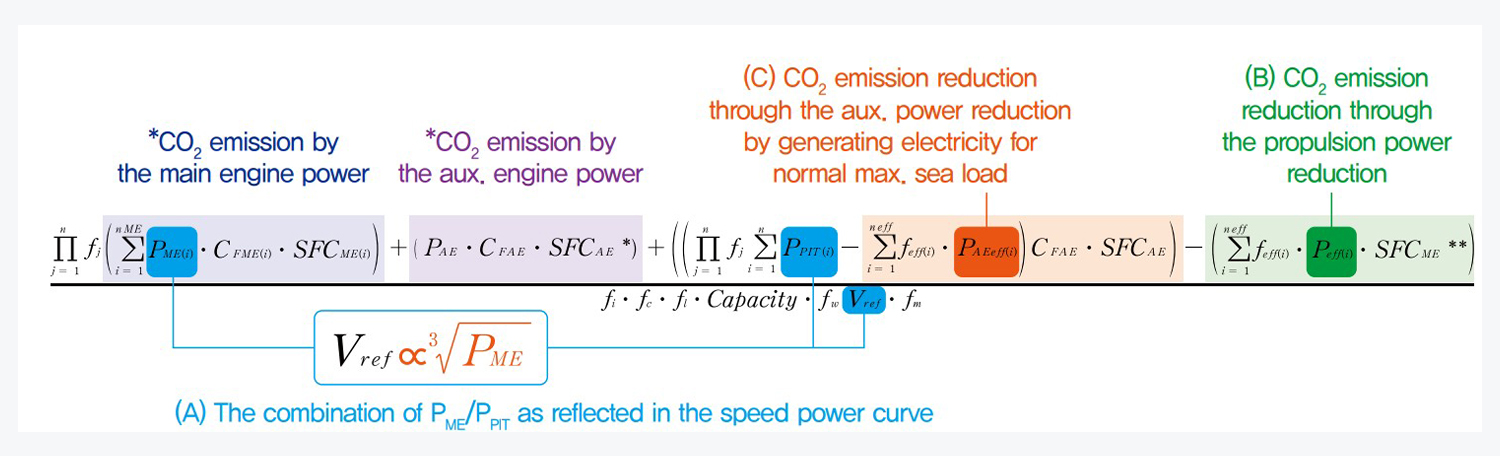
Considerations for the Adoption of Category A Technologies
·Impact on EEDI/EEXI
Energy-saving technologies falling under Category A primarily refer to those that reduce the vessel's resistance or improve propulsion efficiency, thereby increasing the reference speed (Vref) from the power (PME) set by EEDI/EEXI regulations..
※ The combination of PME/PPIT as reflected in the speed power curve
These technologies theoretically reduce the actual fuel consumption based on the power reduction derived from model tests, sea trials, or Computational Fluid Dynamics (CFD). However, the calculation of the attained EEDI/EEXI is based on a predefined formula that incorporates power (PME) and the increased reference speed (Vref). As a result, the power reduction effect of energy-saving technologies is not directly reflected in the improvements of the attained EEDI/EEXI, which is a limitation. Generally, the reference speed (Vref) is approximated to be proportional to the cube root of power. For example, if Category A energy-saving technologies are applied to reduce the brake power by 5% on a vessel, the theoretical improvement effect on the attained EEDI/EEXI may be calculated to be approximately 1.7%.
· Technical/Economic Considerations
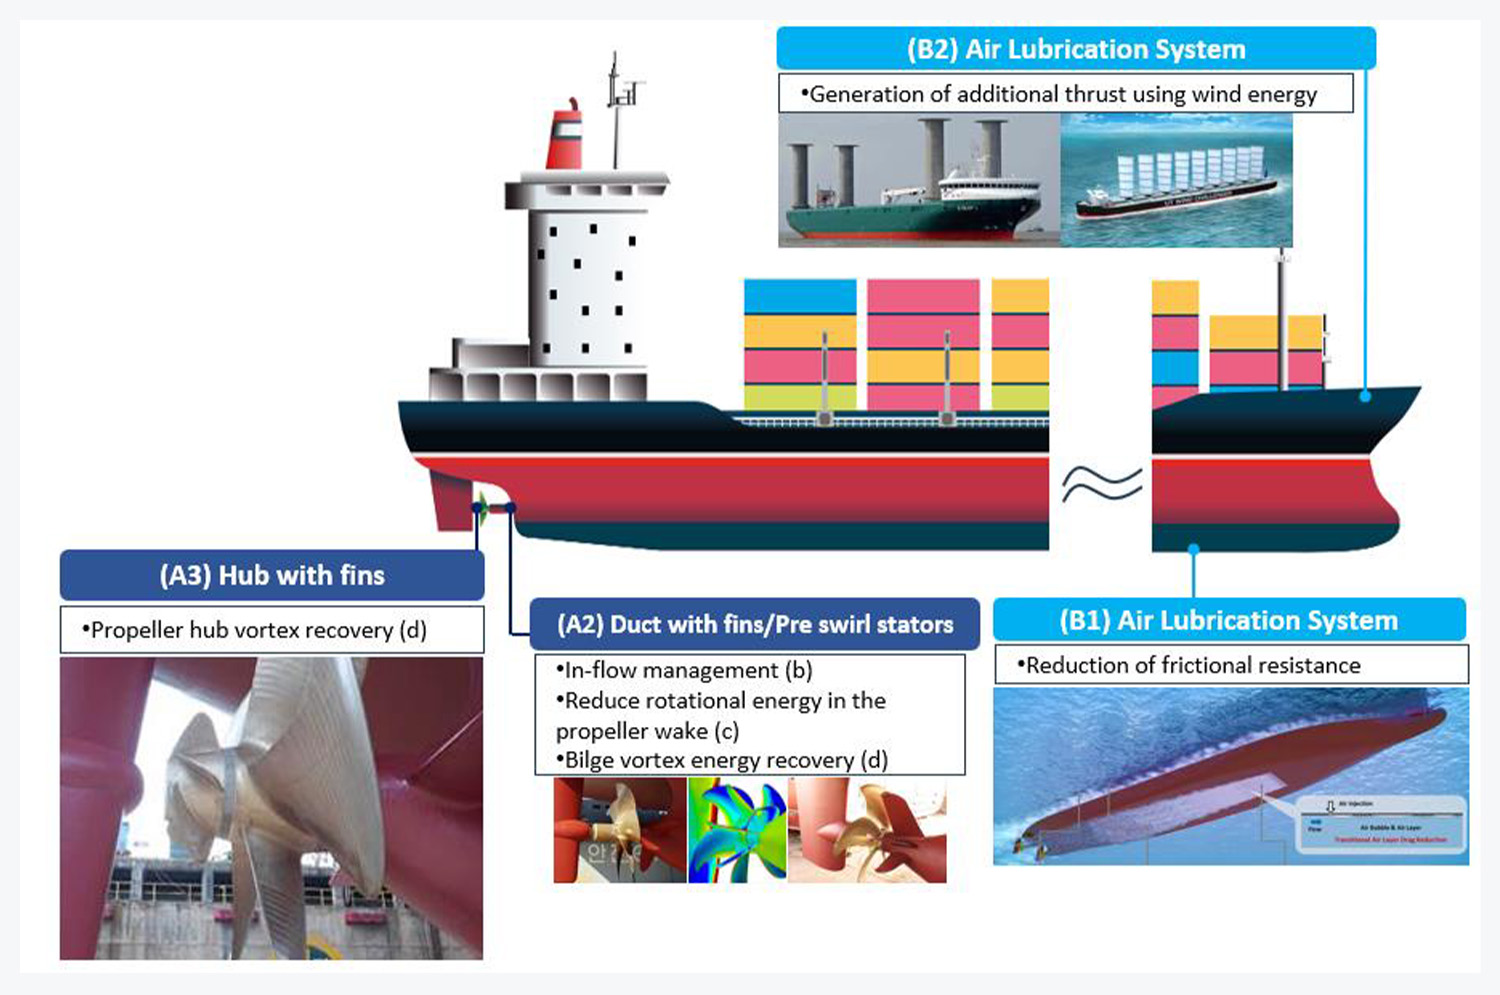
The figure below briefly illustrates the principles and energy-saving mechanisms of the representative Propulsion Improvement Device (PID) energy-saving technologies that shipping companies most commonly selected during recent voluntary re-verifications of EEXI.
Notably, the technologies most commonly selected by shipping companies during recent retrofits for various vessel types, including Bulk Carriers, Tankers, LNG Carriers, and Container Carriers, are as follows: (A1) Vortex Generating Fins, (A2) Duct with Fins/Pre-swirling Stators, (A3) Hub with Fins, (A4) Twisted Rudder with Bulb, and (A5) Wind/Air Resistance Reduction Cap (primarily applied to Container Carriers).
The Principal Concepts and Mechanisms of Representative PID-type
Energy-saving Technologies
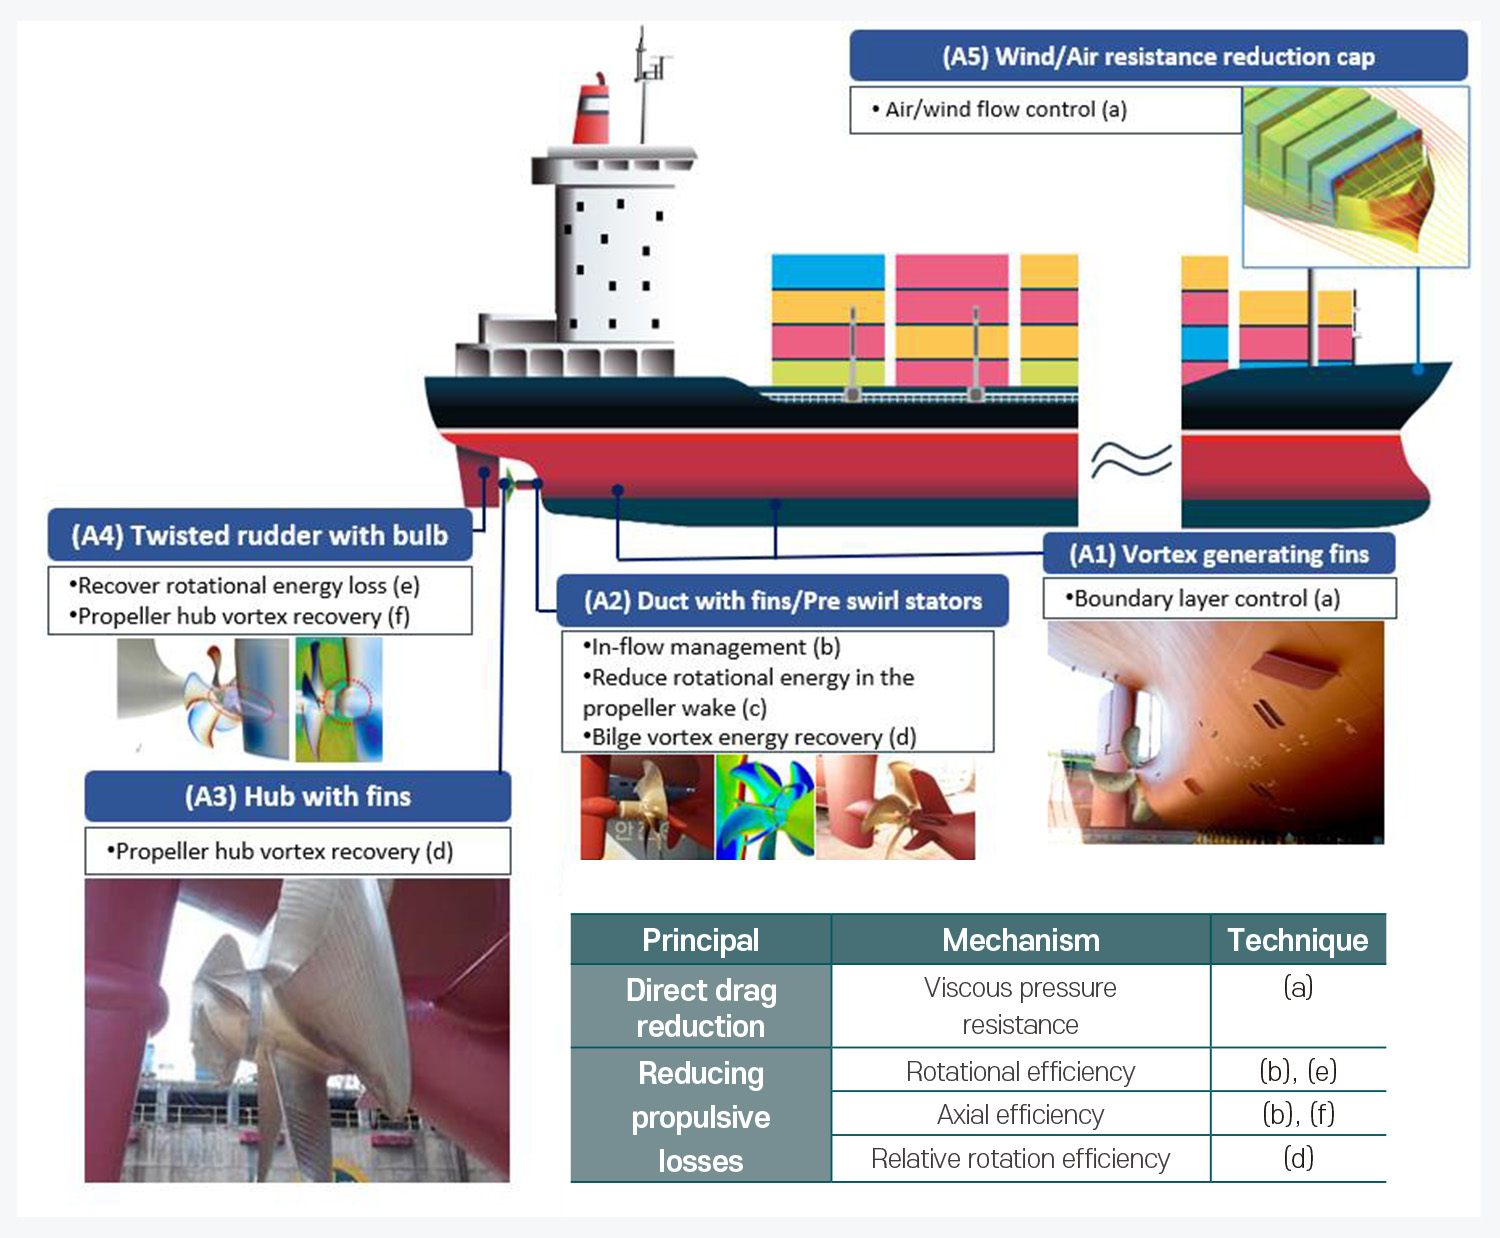

The approximate expected power savings (%), EEXI improvement effects (%), CAPEX (USD), and retrofit duration (from design to installation) for the application of each technology can be predicted as outlined below. Additionally, a prediction of the approximate power savings (%) and EEXI improvement effects (%) has been conducted when energy-saving technologies corresponding to the combination of (A1) + (A2) + (A3) + (A4) are applied to a representative vessel.
However, it is important to note that specific figures may vary depending on the characteristics of the actual speed-power curve and the manufacturer. Analyzing the statistical trends of the limited data used in the analysis, it can be observed that the power-saving effect of energy-saving technologies tends to be greater for slower, bulkier vessels (with older ships benefiting more from energy-saving effects), while such effects diminish for faster, slender vessels(with newer ships showing less benefit from energy-saving effects).
Considerations for the Adoption of Category B Technologies
· Impact on EEDI/EEXI
Energy-saving technologies that fall under Category B are positioned as independent terms on the far right side of the numerator in the EEDI/EEXI calculation formula, as can be observed below.
The technology serves to reduce the vessel's fuel consumption based on the following principles and energy-saving mechanisms.
The Independent Term Influenced by Energy-saving
Technologies of the Category B in the EEDI/EEXI Formula

Energy Saving Method of Category B
| Category | Principal | Mechanism | Technique | Methodology |
|---|---|---|---|---|
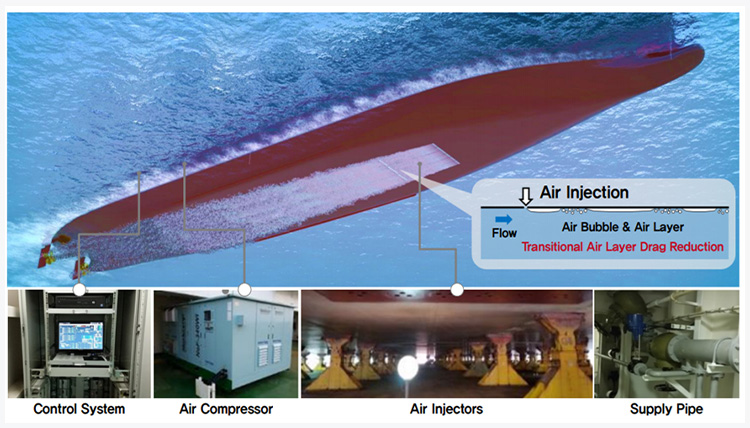
| B-1 | Direct Drag Reduction | Frictional Resistance | Reduce Shear Force | · Air Lubrication System |
| B-2 | Use of Renewable Energy | Wind Energy | Additional Thrust | · Flettner rotor · sails · kite |
Unlike energy-saving technologies of Category A, the power reductions from the main engine due to the air lubrication system (B-1) and the wind-assisted propulsion system (B-2) can be directly applied to the separate term in the numerator of the EEDI/EEXI calculation formula, according to the guidelines of MEPC.1/Circ.896. As a result, the EEDI/EEXI can be improved in proportion to the calculated power reduction rate.
The air lubrication system (B-1) is typically applied to vessels with a flat hull bottom and low draft (e.g., large container ships, LNG carriers). This is advantageous as the flat bottom helps maintain an air lubrication layer formed by fine air bubbles injected from the compressor at high pressure. Additionally, a lower draft allows for a reduction in the capacity of the air compressor, leading to greater net fuel savings (the figure representing fuel savings from the main engine due to the air lubrication system is calculated excluding the fuel consumption of the auxiliary engine that drives the air lubrication system).
The wind-assisted propulsion system (B-2), utilizing Flettner rotors and sails, leverages renewable wind energy to achieve energy savings. This system is primarily applied to vessels with simple superstructure shapes and small surface areas (e.g., bulk carriers, tankers), where sufficient additional propulsion power can be obtained. The expected fuel savings from B-1 and B-2 range from 5% to 9%, making them a notable effective response for satisfying EEDI Phase III requirements in the recent newbuilding market.
SAVER Air, B-2*
*2024 Responding to IMO GHG Regulations: A Selection Guide to Ship Energy Efficiency Technologies, KR-RNDDECB-NF-007
Flettner rotor, B-2*

*R.Leloup,K.Roncin,M.Behrel,G.Bles,J.-B.Leroux,C.Jochum,Y.Parlier, 2015, A continuous and analytical modeling for kites as auxiliary propulsion devoted to merchant ships, including fuel saving estimation, Renewable Energy Volume 86, February 2016, Pages 483-496
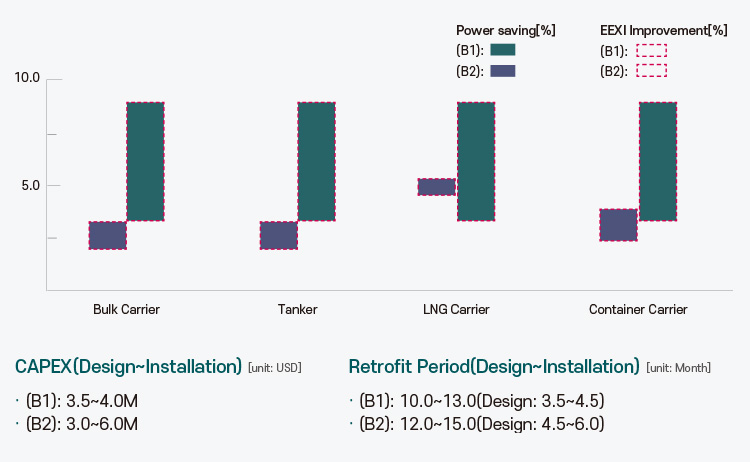
· Technical/Economic Considerations
For vessel types such as Bulk Carriers, Tankers, LNG Carriers, and Container Carriers, the approximate expected power savings (%), EEDI/EEXI improvement effects (%), CAPEX (USD), and retrofit duration (from Design to Installation) when applying the (B1) Air Lubrication System (B-1) and (B2) Flettner Rotor(s) (B-2) technologies, which have been frequently chosen by shipping companies during recent newbuilding or retrofit projects, are predicted as follows. However, specific figures may vary based on actual operating conditions and manufacturers.
Considerations for the Adoption of Category C Technologies
Energy-saving technologies in Category C refer to innovative systems capable of generating electricity, which the vessel's generators are responsible for supplying. In the EEDI/EEXI calculation formula.
The independent term influenced by energy-saving technologies of the
Category C in the EEDI/EEXI formula
These technologies are represented as independent terms in the numerator and serve to reduce the vessel's fuel consumption based on the following principles and energy-saving mechanisms.
Energy saving method of Category C
| Category | Principal | Mechanism | Technique | Methodology |
|---|---|---|---|---|
| C-1 | Waste Heat Recovery | Exhaust Gas | Electricity Generation | · Waste Heat Recovery System |
| C-2 | Use of Renewable Energy | Solar Energy | Electricity Generation | · Photovoltaic Panels |
Energy-saving technologies that fall under Category C can calculate their power generation based on the guidelines of MEPC.1/Circ.896 and apply this to a separate term in the numerator of the EEDI/EEXI calculation formula, effectively converting it into the power reduction from the auxiliary engine. This provides the advantage of directly reflecting the power-saving effects in the improvements of EEDI/EEXI, similar to the technologies in Category B.
The waste heat recovery system (C-1) and solar cells (C-2) are known to have significantly high capital expenditures (CAPEX), with the market indicating that the CAPEX for the waste heat recovery system accounts for approximately 10% of the newbuilding costs. However, both C-1 and C-2 have seen very few applications on large vessels, leading some stakeholders to raise concerns about economic viability and operational safety issues.
Despite these challenges, technologies within Category C hold significant potential to enhance the overall energy efficiency of vessel operations. As the shipbuilding industry continues to evolve and regulatory pressures for decarbonization from the IMO increase, advancements in waste heat recovery and solar technology could provide substantial long-term savings for shipping companies. Furthermore, ongoing research and development efforts may address current limitations, ultimately improving both the operational feasibility and economic justification for broader adoption in the maritime sector.
Schematic diagram of WHR system, C-1*

*2024 Responding to IMO GHG Regulations: A Selection Guide to Ship Energy Efficiency Technologies, KR-RNDDECB-NF-007
Photovoltaic cells, C-2*
*R.Leloup,K.Roncin,M.Behrel,G.Bles,J.-B.Leroux,C.Jochum,Y.Parlier, 2015, A continuous and analytical modeling for kites as auxiliary propulsion devoted to merchant ships, including fuel saving estimation, Renewable Energy Volume 86, February 2016, Pages 483-496
Energy-Saving Technologies and CII
CII is one of the short-term measures devised by the IMO to reduce greenhouse gas emissions from ships, corresponding to the operational measures for existing ships alongside EEXI corresponding to the technical measures. Following the approval of amendments to MARPOL Annex VI at the MEPC 75th session, the final amendments, including technical guidelines, were approved at the MEPC 76th session, making both EEXI and CII mandatory starting from January 1, 2023.
The technical guidelines and key points developed for the smooth implementation of CII, adopted during the MEPC 76th and 78th sessions, are as follows:
· Resolution MEPC.336(76)
CII reference lines guidelines (G1) → Application and calculation methods for individual vessels' attained CII (AER or cgDIST)
· Resolution MEPC.337(76)
CII Reference Lines Guidelines (G2) → Methods for establishing reference line calculations and reference line calculations by vessel type
· Resolution MEPC.338(76)
CII Reduction Factor Guidelines (G3) → Methods for determining CII reduction factors and reduction rates for 2023~2030
· Resolution MEPC.339(76)
CII Rating Guidelines (G4) → Methods for assigning CII ratings to existing vessels
· Resolution MEPC.355(78):
Guidelines for CII Correction Factors and Voyage Adjustments for CII Calculations (G5) → Methods for applying specific correction factors (such as cargo retention, handling systems, etc.) and voyage exclusions (navigating in ice-covered areas, severe sea conditions, or long-term anchorage for safety reasons) in the determination of the attained CII.
These technical guidelines are set to be revised after decisions or agreements reached at the MEPC 83rd session, with most revisions expected to take place after 2026.
· Determined CII reduction rates for 2027~2030 through the MEPC 83rd session
| Year | 2027 | 2028 | 2029 | 2030 |
|---|---|---|---|---|
| Reduction Rate Compared to 2019 (%) |
13.625 | 16.25 | 18.875 | 21.5 |
· Fuel consumption during port waiting time and idle time is usually incurred regardless of the owner's intent, so it has been agreed to exclude the fuel consumption used while at anchor from the calculation of the attained CII and the CII reference lines.
· It has been agreed to further discuss the review of IMO DCS data, the review of CII indicator units (the scope of fuel consumption excluding anchoring, port waiting, and docking), the recalculation of reference lines (amendment of Guidelines G2), and the potential for amendments to other IMO documents in the second phase review to be conducted after 2026.
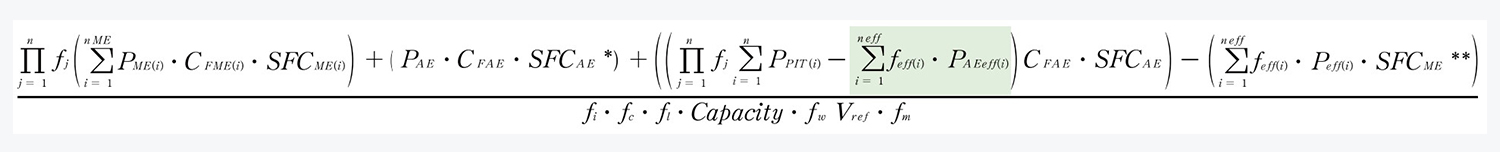
·CII Calculation and Rating Assessment
Calculation of Attained CII
It is predicted that the timing for implementing the agreed amendments related to CII through the MEPC 83rd session (2025) will be reflected after the second phase review to be conducted after 2026, with revisions to G1~G5 guidelines. However, the attained CII is currently calculated based on IMO DCS data, and the calculation formula is as follows:
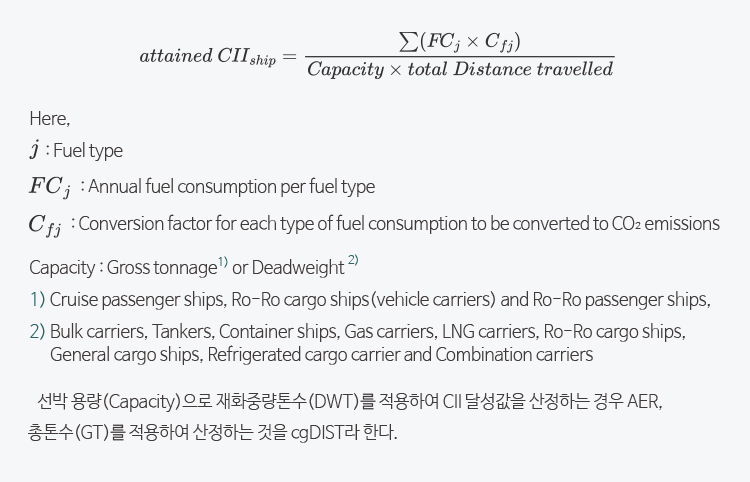
When calculating the attained CII using the vessel's capacity based on deadweight (DWT), it is referred to as AER. When calculated using gross tonnage (GT), it is referred to as cgDIST..
Calculation of Required annual operational CII
To calculate the required annual operational CII, the reference CII for the target vessel must be calculated first, and the formula for determining the reference CII is as follows:

Here, “a” and “c” are parameters derived from the attained CII and the capacities of individual vessels based on the IMO DCS statistics data collected in 2019, with values categorized by vessel type and size as follows:
Parameters for Deriving Baseline by Ship Type
| 선종 | Capacity | a | c | |
|---|---|---|---|---|
| 산적화물선 | 279,000 DWT 이상 | 279,000 | 4745 | 0.622 |
| 279,000 DWT 미만 | DWT | 4745 | 0.622 | |
| 가스운반선 | 65,000 DWT 이상 | DWT | 14405E74) | 2.071 |
| 65,000 DWT 미만 | DWT | 8104 | 0.639 | |
| 탱커선 | DWT | 5247 | 0.610 | |
| 컨테이너선 | DWT | 1984 | 0.489 | |
| 일반화물선 | 20,000 DWT 이상 | DWT | 31948 | 0.792 |
| 20,000 DWT 미만 | DWT | 588 | 0.389 | |
| 냉동화물운반선 | DWT | 4600 | 0.557 | |
| DWT | 40853 | 0.812 | ||
| LNG운반선 | 100,000 DWT 이상 | DWT | 9.827 | 0.000 |
| 65,000 DWT 이상 100,000 DWT 미만 |
DWT | 14479E10 | 2.673 | |
| 65,000 DWT 미만 | 65,000 | 14479E10 | 2.673 | |
| 로로 화물선(차량 운반선) | GT | 5739 | 0.631 | |
| 로로 화물선 | DWT | 10952 | 0.637 | |
| 로로 여객선 | GT | 7540 | 0.587 | |
| 크루즈 여객선 | GT | 930s | 0.383 | |
Once the reference CII is determined, the required annual operational CII is calculated by finally incorporating the reduction rate (G3) as follows:

“Z” is the annual CII reduction factor compared to the 2019 baseline, applied uniformly to all vessels regardless of type and size. The finally confirmed reduction rates for the period from 2023 to 2030 at the MEPC 83rd session are as follows:
Confirmed and expected reduction rate compared to the 2019 baseline
| Year | '23 | '24 | '25 | '26 | '27 | '28 | '29 | '30 |
|---|---|---|---|---|---|---|---|---|
| Reduction rate compared to 2019 |
5.00% | 7.00% | 9.00% | 11.00% | 13.625% | 16.25% | 18.875% | 21.50% |
Determination of CII Ratings
CII ratings range from A to E, with a total of five categories, and the boundary for each rating is determined based on the required CII as follows:
Boundary and Calculation Method for Deriving CII Rating
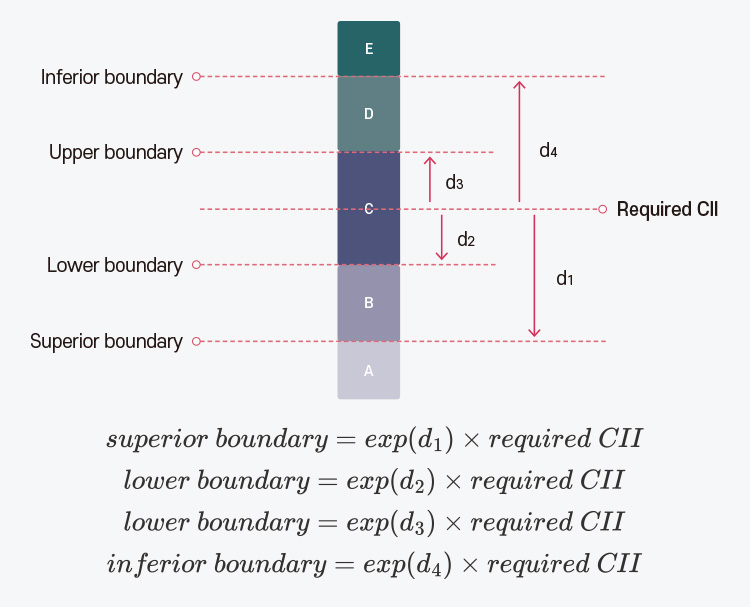
“exp(dx)” represents the exponent of the dd vector, indicating the direction and distance from the required CII, with the values categorized by vessel type and size as follows:
“dd” Vectors by Ship Type for Calculation of CII Rating
| 선종 | Capacity | dd 벡터(vectors) | ||||
|---|---|---|---|---|---|---|
| exp(d1) | exp(d2) | exp(d3) | exp(d4) | |||
| 산적화물선 | DWT | 0.86 | 0.94 | 1.06 | 1.18 | |
| 가스운반선 | 65,000 DWT 이상 | DWT | 0.81 | 0.91 | 1.12 | 1.44 |
| 65,000 DWT 미만 | 0.85 | 0.95 | 1.06 | 1.25 | ||
| 탱커선 | DWT | 0.82 | 0.93 | 1.08 | 1.25 | |
| 컨테이너선 | DWT | 0.83 | 0.94 | 1.07 | 1.17 | |
| 냉동화물운반선 | DWT | 0.78 | 0.91 | 1.07 | 1.20 | |
| 겸용선 | DWT | 0.87 | 0.96 | 1.06 | 1.14 | |
| LNG운반선 | 100,000 DWT 이상 | DWT | 0.89 | 0.98 | 1.06 | 1.13 |
| 100,000 DWT 미만 | 0.78 | 0.92 | 1.10 | 1.37 | ||
| 로로 화물선(차량 운반선) | GT | 0.86 | 0.94 | 1.06 | 1.16 | |
| 로로 화물선 | DWT | 0.66 | 0.90 | 1.11 | 1.37 | |
| 로로 여객선 | GT | 0.72 | 0.90 | 1.12 | 1.41 | |
| 크루즈 여객선 | GT | 0.87 | 0.95 | 1.06 | 1.16 | |

· Limitations of Energy Savings Technology: A Comprehensive Approach is Needed for CII Improvement
Recently, shipping companies have adopted slow steaming strategies based on engine power (or shaft power) limitations as the most practical and cost-effective means of complying with the EEXI and CII regulations for existing vessels. The figure below presents two years of recorded IMO DCS data collected from the same vessel (with the same EEXI) operating on identical routes, illustrating the effectiveness of slow steaming in enhancing the attained CII.
Comparison of 2 Years of Voyage Data for the Same Vessel
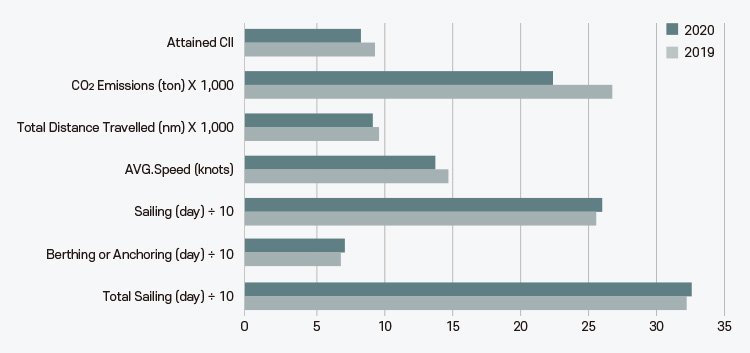
| Year | Total Sailing(day) | Berthing or Anchoring(day) | Sailing(day) | Avg. Speed(knots) | Total Distance Travelled(nm) | CO2 Emissions(ton) | Attained CII |
|---|---|---|---|---|---|---|---|
| 2019 | 325 | 71 | 254 | 14.78 | 94,820 | 26,310 | 9.66 |
| 2020 | 329 | 72 | 257 | 13.80 | 91,470 | 22,780 | 8.59 |
| Difference [%] | +1.2 | +1.4 | +1.2 | -6.6 | -3.5 | -13.5 | -11.1 |
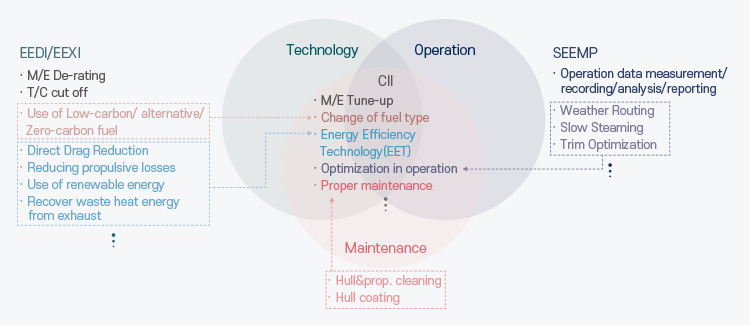
However, limiting engine power (or shaft power) faces several challenges, including reduced speed in charter agreements, the consequent decrease in competitiveness in the charter market, and clear limitations which may not be sustainable in light of the anticipated strengthening of international greenhouse gas emission regulations. Therefore, shipping companies may consider the adoption of energy-saving technologies as one of the short-term cost-effective alternatives.
Historical cases of EEDI/EEXI approval demonstrate that energy-saving technologies can directly reduce a vessel's resistance and propulsion losses through various methods, including simple appendage-type devices or more complex electric control systems. Additionally, these technologies can leverage renewable energy sources like wind to generate additional thrust, thereby decreasing the vessel's fuel consumption (CO2 emissions) and garnering attention as effective responses to technical regulations such as EEDI/EEXI.
In contrast, CII is determined based on various data collected from the actual annual operations of existing vessels, unlike EEDI/EEXI. To improve the attained values and ratings of CII, it is necessary to integrate optimal operational strategies and appropriate maintenance methods alongside design-oriented responses like energy-saving technologies. Therefore, a comprehensive effort is required to minimize fuel consumption (CO2 emissions) as measured and reported within the IMO DCS framework by utilizing all these approaches.
| Principal | Mechanism | Technique | Methodology |
|---|---|---|---|
| Operation | Optimization in Operation | ICT | Weather routing |
| Slow steaming | |||
| Aging | Maintenance | Docking | |
| Roughness treatment |
For example, as illustrated in the previous figure, even when the same energy-saving technology is implemented and the vessel has attained the same EEXI, it can be observed that the attained CII significantly decreased in 2020 compared to 2019. The primary reason is that while the number of operational days and mooring periods were similar in both periods, the total operational distance in 2020 was reduced by approximately 3.5% due to slow steaming, while the total fuel consumption (CO2 emissions) decreased by about 6.6%.
As shown in the previous example, to reduce the fuel consumption (CO2 emissions) measured within the IMO DCS framework, a thorough analysis of the vessel's historical operational pattern data must precede. Additionally, for effective data analysis, systematic data collection on external environmental conditions such as the vessel's mechanical operating state, weather, and sea state is essential. This underscores the necessity for a comprehensive measurement and monitoring system (smart platform) capable of managing these data.
Such a measurement system must be able to record real-time changes in the mechanical states of the vessel, including environmental factors that significantly affect the vessel's resistance characteristics, such as wind, waves, and currents during actual operations, as well as parameters like draft, trim, main engine output, RPM, and speed. Based on this information, shipping companies will be able to accurately diagnose the necessary measures to improve the targeted CII rating (e.g., operational aspects, design-oriented aspects like the introduction of energy-saving technologies, and maintenance aspects), which will be an indispensable prerequisite for establishing customized CII response strategies.
Respond ways to IMO GHG emissions regulations
The Role of Energy-Saving Technologies in Response to Greenhouse Gas Fuel Intensity (GFI)
The Role of Energy-Saving Technologies in Response to Greenhouse Gas Fuel Intensity (GFI) One of the critical issues in the international community's response to greenhouse gas regulations is the transition from fossil fuels to eco-friendly fuels for shipping. This transition to eco-friendly fuels is expected to gain momentum after the implementation of the IMO’s mid-term measures in 2027.
The GFI regulation, which is a key component of the IMO's mid-term measures aimed at reducing greenhouse gases and approved during the 83rd MEPC session (April 2025), is set to be newly added to the MARPOL Annex VI amendment. It is scheduled to be adopted during the special session of the MEPC set for October 2025 and will enter into international force on March 1, 2027. Additionally, the MEPC 83 session agreed to hold an Inter-Session Working Group (ISWG) meeting immediately after the special session and just before the 84th MEPC session to develop various guidelines to support the implementation of the IMO’s mid-term measures (including calculation guidelines for attained GFI determination, compliance measures, and guidelines for compensating ships using zero or near-zero fuels or technologies).
The main content* related to the greenhouse gas annual intensity (GFI) regulation are as follows:
* KR IMO News Flash (MEPC 83)
▶While IMO Mid-term measures will enter into force on 1 March 2027, given that the attained GFI could only be calculated using data from the full preceding calendar year (1 January to 31 December), all applicable ships shall collect GFI data starting from 1 January 2028 and report the relevant data to the Administration or RO for GFI verification in early 2029
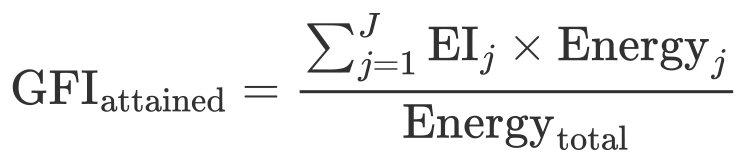
▶The formula below calculates the average GHG intensity of all energy and fuels used by a ship. It multiplies the GHG intensity (EI) of each energy source by the energy used (Energy), sums the results, and divides by the total energy consumption (Energytotal) to obtain the attained GFI value. A lower value indicates more environmentally friendly energy usage
▶Target GHG fuel intensity (GFI) starts at 93.3 gCO2eq/MJ, representing the average GFI of international shipping in the year 2008
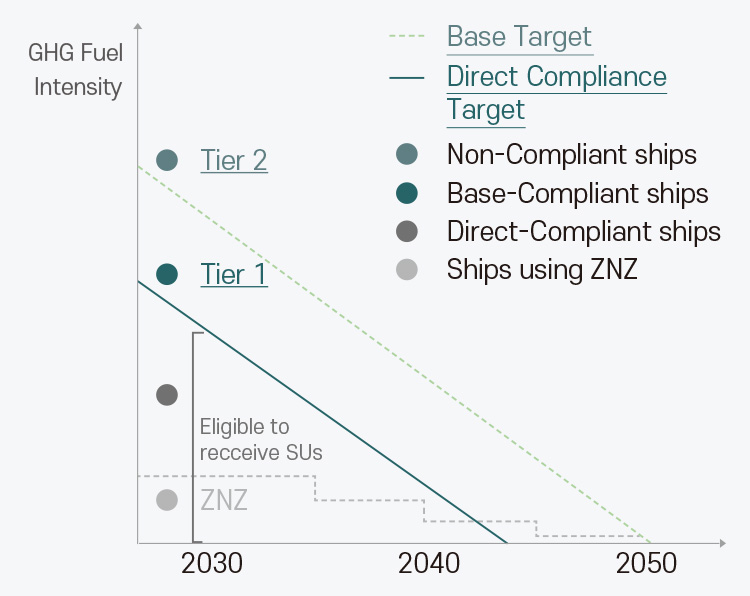
▶Target annual GFI consists of two tiers: a Base Target annual GFI (Base Target) and Direct Compliance Target annual GFI (Direct Compliance Target)
▶ Bast Targets and Direct Targets are as follows:
| Year | Reduction Rate for Base Target(%) | Reduction Rate for Direct Compliance Target(%) |
|---|---|---|
| 2028 | 4.0 | 17.0 |
| 2029 | 6.0 | 19.0 |
| 2030 | 8.0 | 21.0 |
| 2031 | 12.4 | 25.4 |
| 2032 | 16.8 | 29.8 |
| 2033 | 21.2 | 34.2 |
| 2034 | 25.6 | 38.6 |
| 2035 | 30.0 | 43.0 |
▶The determined Basic Targets and Direct Targets are utilized for the classification of “Tier 1” and “Tier 2” based on the GHG emissions from individual ships, as mentioned in the “Compliance Approaches” section as below
▶While the Basic Targets and Direct Targets for the years 2036 to 2040 will be determined by 1 January 2032, Basic Target for the year 2040 shall be set at 65%
▶To comply with the GFI requirements, ships may trade GHG emissions among themselves. Ships that are unable to meet the GFI target may offset their excess emissions by purchasing Surplus Units from ships using low-emission fuels or by purchasing Remedial Units at a predetermined price through a registry
▶The following approaches are provided to comply with the GFI requirements:
- Ships with an attained GFI falling within Tier I must offset their emissions exceeding the Direct Target by purchasing Remedial Units (USD 100 per GHG tonne) from the registry. In this case, purchasing Surplus Units from ships low-emission fuels is impossible.
- Ships with an attained GFI falling within Tier II must offset their emissions exceeding the Base Target by purchasing, in addition to the Tier I amount, Surplus Units at market price from ships using low-GHG fuels or by purchasing Remedial Units (USD 380 per GHG tonne) from the registry.
- Ships using low-GHG fuels (where attained GFI falls outside Tier I and Tier II) will generate Surplus Units and sell them to ships that fail to meet the Base Target, thereby creating a revenue-generating opportunity. In addition, ships employing zero or near-zero GHG fuels and technologies are eligible for incentive benefits.
▶Zero or near-zero GHG emission technologies, fuels and/or energy sources should meet the following criteria, and ships utilizing such fuels and technologies with GHG emissions below the specified thresholds may qualify for incentives.
| Year | Until 2034 | From 2035 onward |
|---|---|---|
| WtW GFI (gCO2eq/MJ) | 19.0 | 14.0 |
▶The details of ZNZ energy sources and technologies, as well as the corresponding compensation amounts, will be reviewed every five years and shall comply with the requirements set forth in the guidelines to be developed in the future.
▶The fund generated from the IMO mid-term measures will be utilized for various uses, including providing incentives for alternative-fuel ships, developing infrastructure for alternative fuel supply in developing country ports, supporting GHG-vulnerable countries such as small island developing states (SIDS) and administrative expenses, etc.

· Future Impact of Energy-Saving Technologies: Increase vs. Decrease
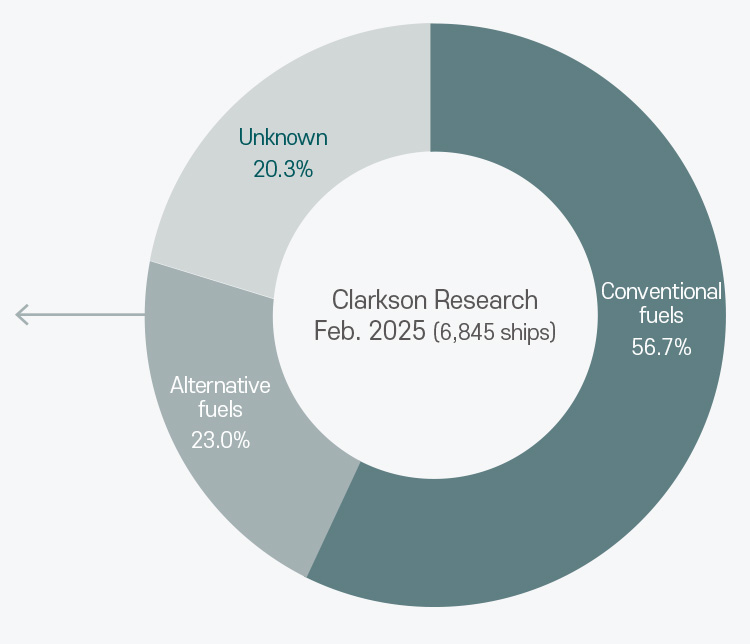
To predict the future impact of energy-saving technologies (mainly payback time predictions), the representative fuel types considered include HFO, LNG, LPG, Bio-Diesel, Bio-Methanol, and e-Ammonia, based on the 2025 Clarkson Research order book* for dual-fuel vessels as of February 2025.
Before the recent finalization of IMO's GFI regulation, shipping companies generally believed that when vessels use expensive fuels (eco-friendly fuels), the OPEX costs would increase in proportion to the price of the fuel being bunkered. Additionally, it was theorized that adopting energy-saving technologies would result in the shortest payback time for CAPEX when using the most expensive fuel.
*Clarkson Research Feb. 2025.
Proportion of Alternative Fuels
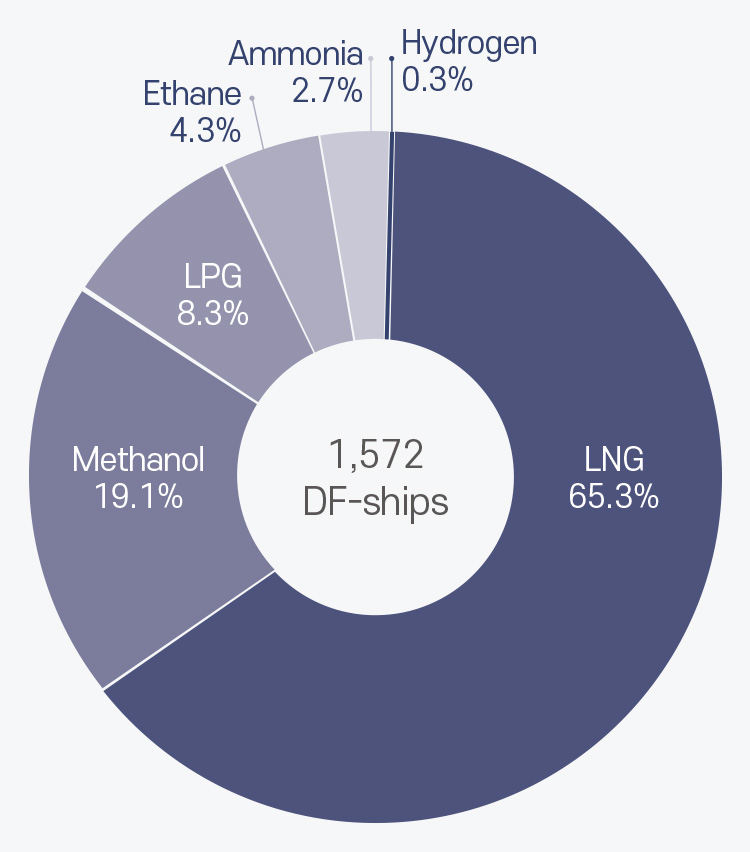
2025 Order Book
However, as indicated by the following analysis, when considering IMO's mid-term measure, GFI, it can be seen that the annual remedial units or surplus units generated vary by fuel type, which subsequently influences the vessel’s 'net OPEX: annual fuel costs + remedial unit purchase costs or - surplus unit sale revenues' differently. This impact does not perfectly align with the simple prediction that the payback period would be shorter when using more expensive fuels compared to relatively cheaper fuels (for Bio-Diesel).
Assumptions for predicting the investment cost recovery timing (payback time) associated with the adoption of energy-saving technologies are as follows:
▶HFO (HSHFO) consumption assumed at 12,820 MT annually (515,364,000 MJ), operating on non-EU routes.
▶OPEX forecasts by fuel type are based on the Clarkson Research order book[4] for dual-fuel vessels released in 2025.
▶GFI cost calculations: reflecting results from the 83rd MEPC.
▶Information on 'Initial Default Emission Factors per Fuel Pathway Code' necessary for GFI calculations of fuel types not included in the 2024 IMO LCA Guideline is referenced from FuelEU Maritime.
▶OPEX considers only annual fuel consumption (fuel costs) and GFI impact.
▶Types of energy-saving technologies applied: (A2)+(A3), (B1), (B2)
▶Types of vessels to which energy-saving technologies ((A2)+(A3), (B1), (B2)) are applied: Bulk Carrier, Tanker, LNG Carrier, Container Carrier.
▶‘Energy-saving technologies' CAPEX is as follows (to be implemented in 2026):
| Technology | CAPEX (USD) | Remark |
|---|---|---|
| (A2) Duct with Fins/Pre-swirl Stators + (A3) Hub with Fins (Category A) | 0.90 M | Installation in 2026 |
| (B1) Air Lubrication System (Category B-1) | 3.75 M | |
| (B2) Wind Assisted Propulsion System (Category B-2) | 5.00 M |
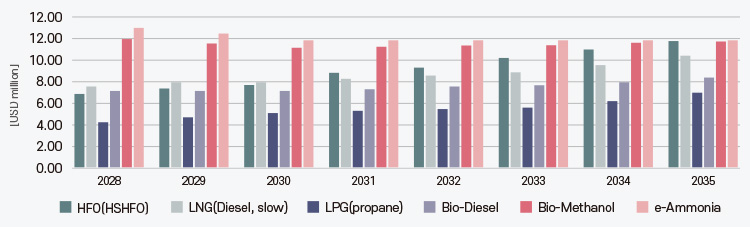
The figure below illustrates the annual OPEX predictions by fuel type based on the forecasted bunker prices of fuels, excluding the consideration of GFI(GHG Fuel Intensity).
Estimated OPEX for Annual Voyages by Fuel Type(GFI Excluded)
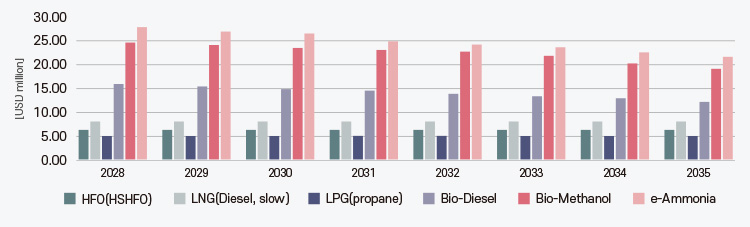
As seen in the figure above, the higher the price of eco-friendly fuels, the greater the production and supply costs, which results in higher bunker costs as well. This trend indicates that the annual operating costs (OPEX) for the ships considered may increase by 4 to 5 times compared to fossil fuels. However, with the enforcement of GFI (Greenhouse Gas Fuel Intensity) regulations, the annual OPEX predictions are expected to vary significantly due to the impacts of 'Remedial Units' and 'Surplus Units' based on fuel type.
Therefore, the ‘net OPEX’ reflecting the impact of GFI regulations by fuel type has been estimated. The figure below shows that over time, the annual ‘net OPEX’ for fossil fuels and eco-friendly fuels tends to converge. This can be interpreted as the increasing cost of purchasing 'Remedial Units' for fossil fuels over time, while the revenue from selling 'Surplus Units' for eco-friendly fuels increases, thereby meaning that the initial (2028) ‘net OPEX’ difference between the two fuel types is largely offset.
The 'Remedial Units' for eco-friendly fuels presented in the results below are calculated in accordance with GFI regulations, with the assumption that the 'Surplus Units' are sold at $380 per ton in the market.
Estimated OPEX for Annual Voyages by Fuel Type(GFI Included)
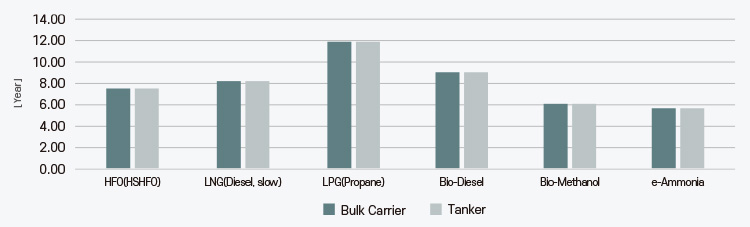
Forecasting CAPEX Payback Time for 'Energy-saving Technologies:(A2)+(A3)'by Vessel Type and Fuel Type

Analyzing the CAPEX payback periods for different ship types based on the application of Energy Saving Technologies classified as Category-A under MEPC.1/Circ.896, specifically ‘(A2)+(A3)’, using the results from fossil fuel HFO (HSHFO), it is found that the payback period is approximately 2 years for Bulk Carriers, which is the shortest, and approximately 4.5 years for LNG Carriers, which is the longest. This suggests that the applied energy-saving technologies ((A2)+(A3)) are relatively less effective in LNG Carriers compared to Bulk Carriers. Although there are numerical differences in the CAPEX payback periods across all fuel types, the overall trends are quite similar.
Another noteworthy point is that the CAPEX payback time for eco-friendly fuels is reported to be about twice as short for Bulk Carriers and Tankers, where the application effect of ‘(A2)+(A3)’ is known to be the greatest, as compared to fossil fuels. Other ship types also show a payback period that is approximately 1.5 times shorter. This trend is attributed to the GFI regulations providing significant low (zero) carbon incentives for eco-friendly fuels, which reduce ‘net OPEX’. However, the projected bunker prices of the applied eco-friendly fuels are still expected to be significantly higher than those of fossil fuels. This could serve as a very positive factor for shipping companies considering the adoption of energy-saving technologies classified as Category-A by MEPC.1/Circ.896.
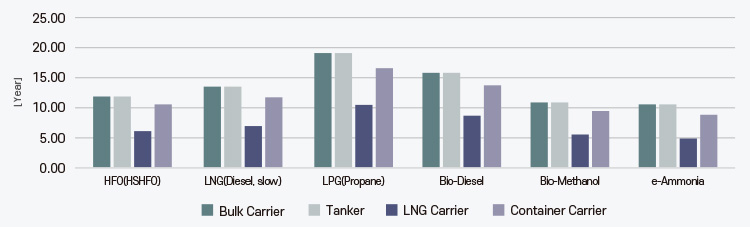
Forecasting CAPEX Payback Time for '(B1):Air Lubrication System(B-1)' by Vessel Type and Fuel Type
Forecasting CAPEX Payback Time for '(B2):Wind Assisted Propulsion System(B-2)' by Vessel Type and Fuel Type
The predicted CAPEX payback time for different ship types based on the application of Energy Saving Technologies classified as Category-B, namely ‘(B1) and (B2)’, show a significantly different trend compared to the results from the application of Energy Saving Technologies classified as Category-A, specifically ‘(A2)+(A3)’. To compare under similar conditions as the previous predictions, the forecast results based on fossil fuel HFO (HSHFO) indicate that the CAPEX of ‘(B1)’ is over 4 times longer than that of ‘(A2)+(A3)’, with the longest payback time of approximately 12 years for Bulk Carriers and the shortest of about 7 years for LNG Carriers. This suggests that the applied energy-saving technology ‘(B1)’ provides relatively superior energy-saving effects (net energy savings: the reduction in frictional resistance due to the application of energy-saving technology minus the energy required to drive the air compressor) in LNG Carriers compared to Bulk Carriers. Additionally, due to the technical characteristics of energy saving related to ‘(B1)’, ship types with flat bottom surfaces and shallow drafts (e.g., LNG Carriers, Container Carriers, etc.) show greater ‘net energy saving effects’. This trend shows similar overall patterns with relative numerical differences in CAPEX payback times across all fuel types.
Another noteworthy point is that the CAPEX payback time for eco-friendly fuels does not show significant differences compared to fossil fuels in LNG Carriers and Container Carriers, where the application of ‘(B1)’ results in the greatest energy-saving effects. In contrast, Bulk Carriers and Tankers, where the effects of ‘(A2)+(A3)’ are greatest, show substantial differences in CAPEX payback times between eco-friendly fuels and fossil fuels. Similarly, in other ship types, the results of applying ‘(B1)’ show a significant reduction in the differences between the payback times for eco-friendly and fossil fuels compared to the results of ‘(A2)+(A3)’. This characteristic is judged to be primarily caused by the high CAPEX of ‘(B1)’, and can be further detailed as follows:
▶In the case of fossil fuels, when the cost of purchasing ‘Remedial Units’ is reflected in the OPEX of the respective ship, the increased OPEX compared to the bunker costs can be partially reduced through the energy-saving technologies of ‘(A2)+(A3)’, which have a CAPEX of $0.9M. This allows for a shorter predicted payback time. However, when applying ‘(B1)’, the payback time is significantly longer, exceeding 10 years for most ship types (for example, approximately 7 years for LNG Carriers, which experience the greatest energy-saving effects from the application of ‘(B1)’), as the CAPEX of ‘(B1)’ is $3.75M, which is quite high
▶Similarly, in the case of eco-friendly fuels, even if the revenue from selling ‘Surplus Units’ is reflected in the OPEX, and the OPEX is further reduced through the energy-saving technology of ‘(B1)’, the high CAPEX of ‘(B1)’ (which accounts for about one-third of the annual OPEX for the application of eco-friendly fuels) results in a payback time that remains significantly long, around 10 years for most ship types (approximately 5 years for LNG Carriers, where the application of ‘(B1)’ yields the greatest energy-saving effects).

The analysis of the CAPEX payback time for the application of energy-saving technology ‘(B2)’ across different ship types shows that, due to its significantly high CAPEX, its overall trends are similar to those of ‘(B1)’. The main reasons for these findings can be summarized as follows:
▶‘(B2)’ is primarily installed on the upper deck of the ship; therefore, only Bulk Carriers and Tankers, which have sufficient installation space on the upper deck and experience minimal interference from wind (i.e., smaller surface area of the superstructure), have been considered for this analysis.
▶Although the CAPEX of ‘(B2)’ is found to be $5.0M, which is higher than that of ‘(B1)’, the expected energy-saving effects are considered to be, on average, more than twice that of ‘(B1)’ across all ship types. As a result, the payback time for ‘(B2)’ is approximately half as short compared to that of ‘(B1)’.
However, the predicted CAPEX payback time for energy-saving technologies based on the annually forecasted 'net OPEX' of eco-friendly fuels requires careful analysis for the following two reasons:
▶First, the '2024 IMO LCA Guidelines' have not yet established the 'Initial Default Emission Factors per Fuel Pathway Code' needed for calculating GFI for fuels such as biodiesel, biomethanol, and e-ammonia. For this reason, 'Initial Default Emission Factors' for the eco-friendly fuels being considered have been referenced from FuelEU Maritime, and since these figures are determined by the EU, their applicability to the calculation of the IMO GHG fuel intensity (GFI attained) is not verified.
▶Second, the assumed market selling price for the 'Surplus Units' generated from biodiesel, biomethanol, and e-ammonia, set at $380 per ton according to GFI regulations, is likely to rise further. This directly impacts the calculation of the 'net OPEX' for eco-friendly fuels and ultimately affects the predicted CAPEX payback time for energy-saving technologies significantly.
Therefore, the prediction method for the CAPEX payback time in relation to the introduction of energy-saving technologies considering the use of eco-friendly fuels should be approached cautiously until additional information on the 'Initial Default Emission Factors per Fuel Pathway Code' required for GFI calculations is included in the revised '2024 IMO LCA Guidelines'.
In conclusion, the enforcement of the GFI regulation as a mid-term measure for IMO's greenhouse gas emissions regulation (effective March 1, 2027) highlights that, in the current situation where fossil fuels dominate the shipping industry's fuel use, energy-saving technologies are viewed as an attractive option for shipping companies to respond to greenhouse gas regulations in both the short and medium terms. Furthermore, the gradual transition from fossil fuels to eco-friendly fuels is becoming increasingly clear as essential for achieving the IMO's intermediate targets for 2030/2040 and the 2050 carbon-neutral goal.
However, unfortunately, many experts predict that even if the shipping industry transitions significantly to the era of eco-friendly fuel use by 2040, the bunker prices of eco-friendly fuels will remain quite high due to various reasons (e.g., infrastructure development, production economics). On the other hand, this suggests that the role of energy-saving technologies, which can directly reduce fuel consumption during vessel operations, will continue to receive attention. Additionally, the possibility of future strengthening of IMO's policy regulations to promote such technologies (e.g., strengthening greenhouse gas reduction targets, raising carbon trading prices, etc.) cannot be ruled out.